

Question: CHAPTER 2 ASSIGNMENT DESCRIBING DATA: FREQUENCY DISTRIBUTIONS AND GRAPHIC PRESENTATION Un Sethvisa: Section Score I Select the correct answer and write the appropriate letter in
CHAPTER ASSIGNMENT
DESCRIBING DATA: FREQUENCY DISTRIBUTIONS AND GRAPHIC PRESENTATION
Un Sethvisa:
Section
Score
I Select the correct answer and write the appropriate letter in the space provided
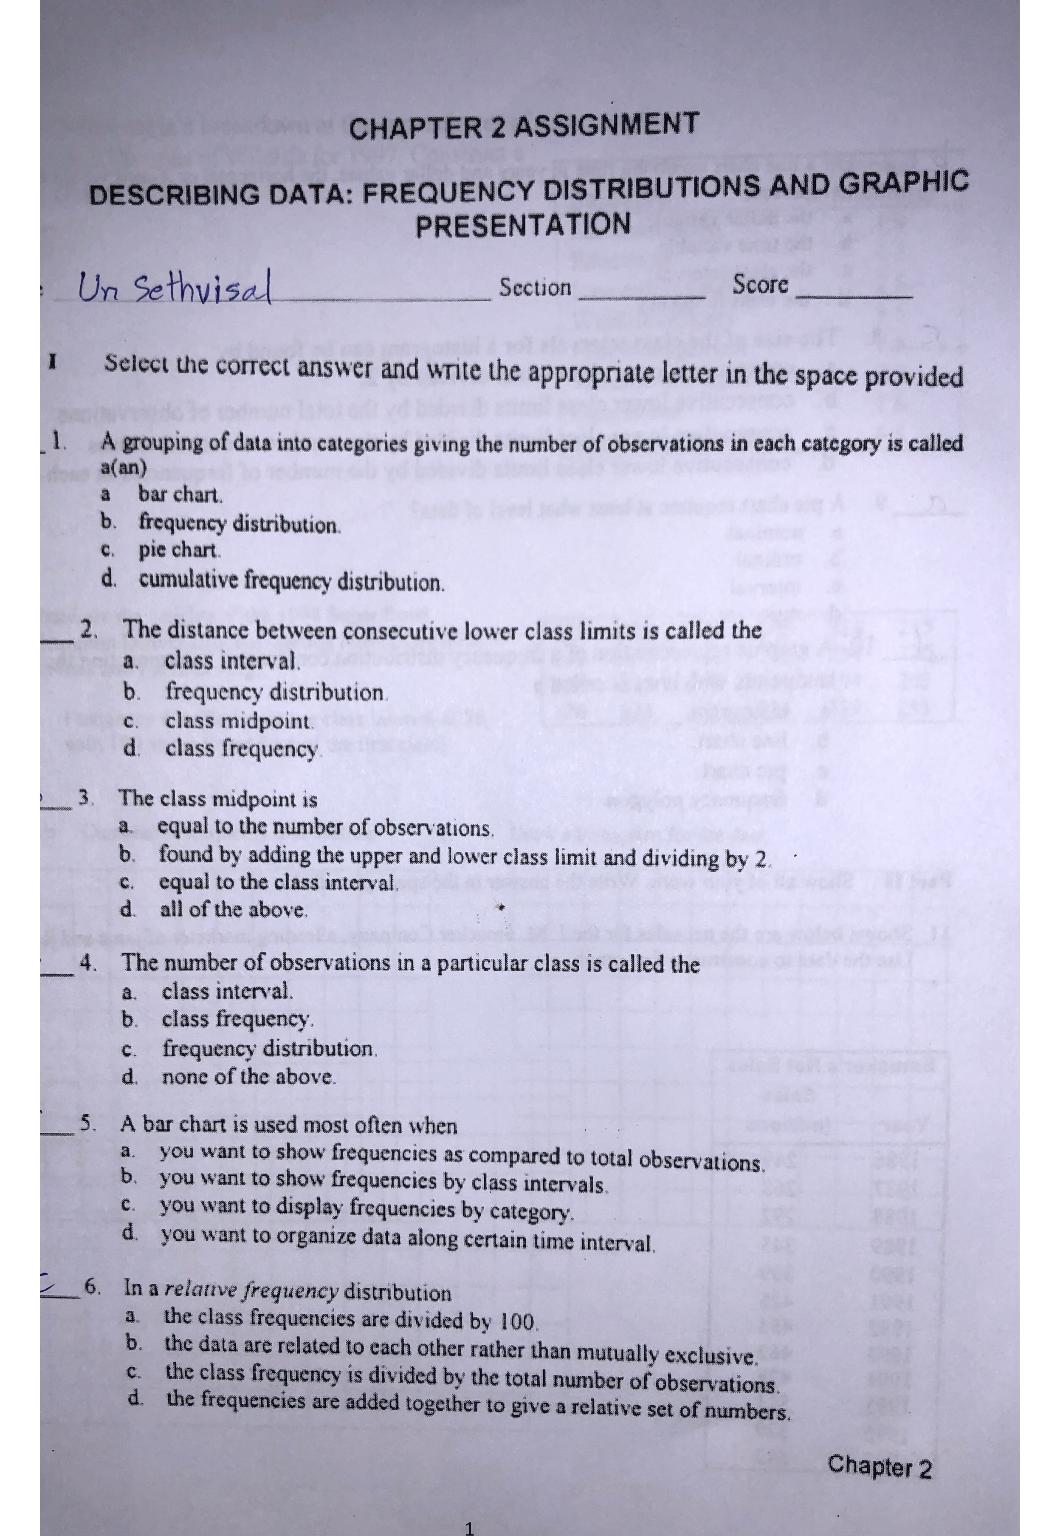
A grouping of data into categories giving the number of observations in each category is called an
a bar chart.
b frequency distribution.
c pie chart.
d cumulative frequency distribution.
The distance between consecutive lower class limits is called the
a class interval.
b frequency distribution.
c class midpoint.
d class frequency.
The class midpoint is
a equal to the number of observations.
b found by adding the upper and lower class limit and dividing by
c equal to the class interval.
d all of the above.
The number of observations in a particular class is called the
a class interval.
b class frequency.
c frequency distribution.
d none of the above.
A bar chart is used most often when
a you want to show frequencies as compared to total observations.
b you want to show frequencies by class intervals.
c you want to display frequencies by category.
d you want to organize data along certain time interval.
In a relarive frequency distribution
a the class frequencies are divided by
b the data are related to each other rather than mutually exclusive.
c the class frequency is divided by the total number of observations.
d the frequencies are added together to give a relative set of numbers.
Chapter
Step by Step Solution
There are 3 Steps involved in it
1 Expert Approved Answer
Step: 1 Unlock

Question Has Been Solved by an Expert!
Get step-by-step solutions from verified subject matter experts
Step: 2 Unlock
Step: 3 Unlock