

Question: Chapter 2 Case Study, Southwest Airlines, Question # 1 . You will need to specifically submit charts / graphs along with analysis / conclusions in
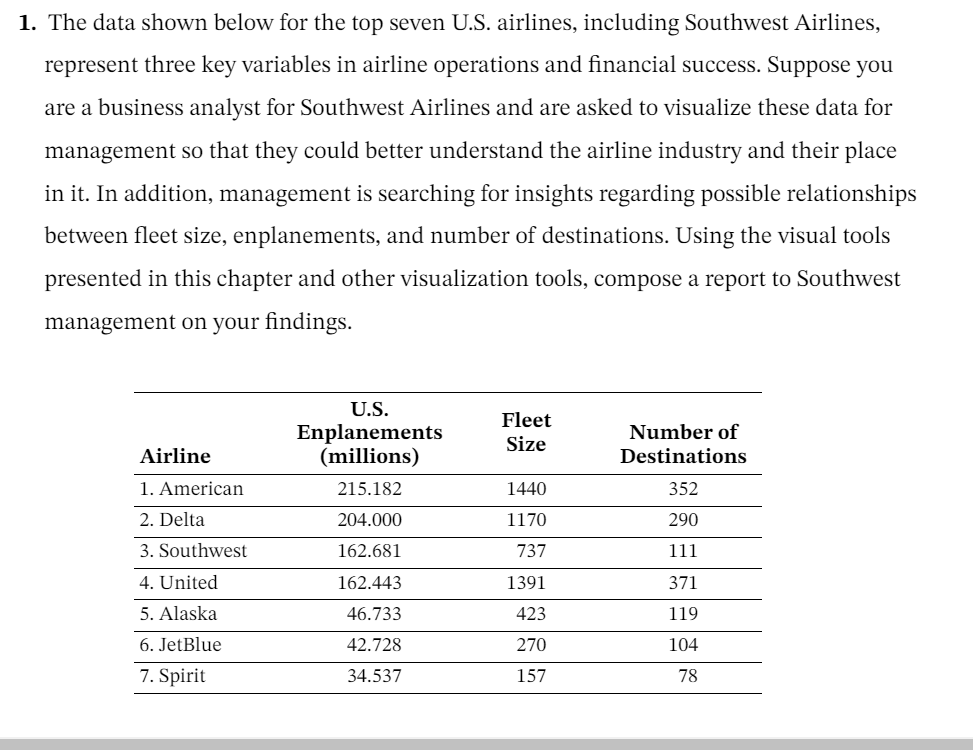
Chapter Case Study, Southwest Airlines, Question # You will need to specifically submit chartsgraphs along with analysisconclusions in an Excel format.The data shown below for the top seven US airlines, including Southwest Airlines,
represent three key variables in airline operations and financial success. Suppose you
are a business analyst for Southwest Airlines and are asked to visualize these data for
management so that they could better understand the airline industry and their place
in it In addition, management is searching for insights regarding possible relationships
between fleet size, enplanements, and number of destinations. Using the visual tools
presented in this chapter and other visualization tools, compose a report to Southwest
management on your findings.
Step by Step Solution
There are 3 Steps involved in it
1 Expert Approved Answer
Step: 1 Unlock

Question Has Been Solved by an Expert!
Get step-by-step solutions from verified subject matter experts
Step: 2 Unlock
Step: 3 Unlock