

Question: Chapter 2: Measuring National Output Case Study 3 Table : National income data of Malaysia for a year 2017 - 2021 (in constant 2015 prices)
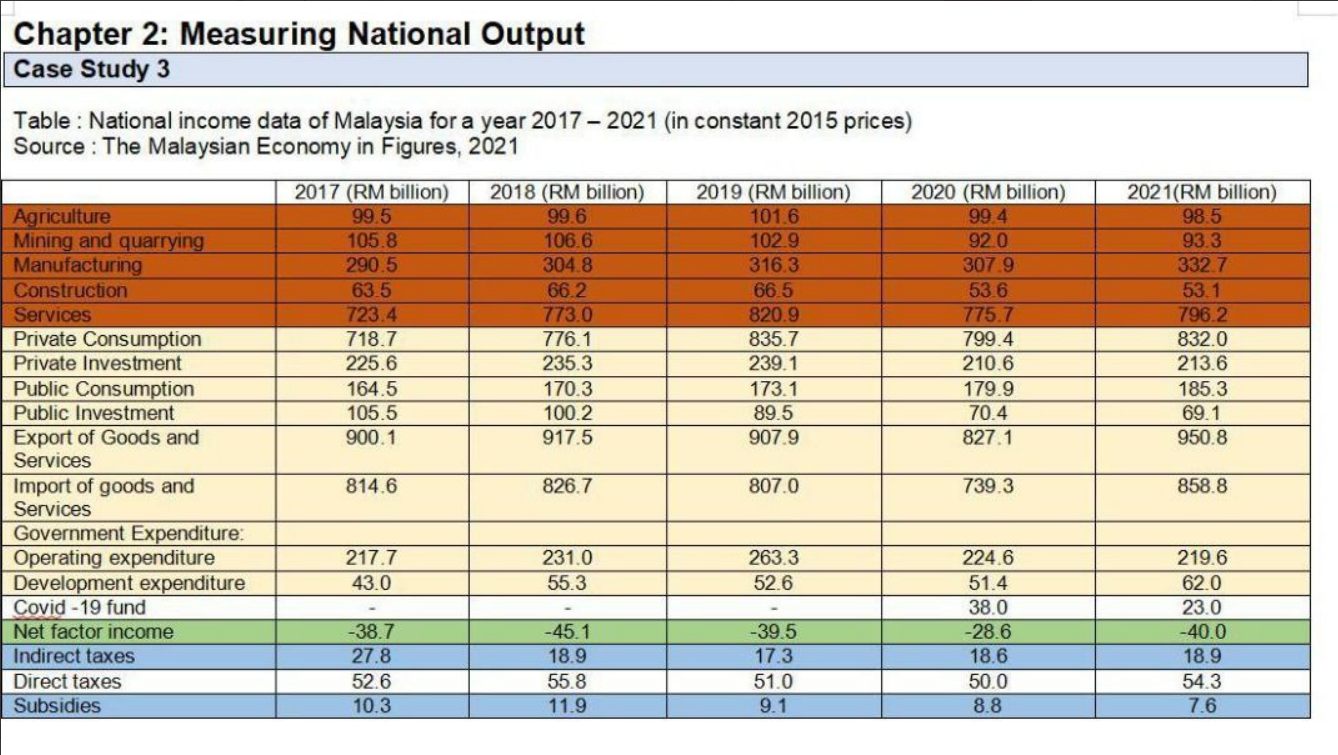

Chapter 2: Measuring National Output Case Study 3 Table : National income data of Malaysia for a year 2017 - 2021 (in constant 2015 prices) Source : The Malaysian Economy in Figures, 2021 2017 (RM billion) 2018 (RM billion) 2019 (RM billion) 2020 (RM billion) 2021(RM billion) Agriculture 99.5 99 6 101.6 99.4 98 5 Mining and quarrying 105.8 106.6 102.9 92 0 93.3 Manufacturing 290.5 304.8 316.3 307.9 332.7 Construction 63.5 66.2 66.5 53 6 53.1 Services 723.4 773.0 820.9 775.7 796.2 Private Consumption 718.7 776.1 835.7 799.4 832.0 Private Investment 225.6 235.3 239.1 210.6 213.6 Public Consumption 164.5 170.3 173.1 179.9 185.3 Public Investment 105.5 100.2 89.5 70.4 69.1 Export of Goods and 900.1 917.5 907.9 827.1 950.8 Services Import of goods and 814.6 826.7 807.0 739.3 858.8 Services Government Expenditure: Operating expenditure 217.7 231.0 263.3 224.6 219.6 Development expenditure 43.0 55.3 52.6 51.4 62.0 Covid -19 fund 38.0 23.0 Net factor income -38.7 -45.1 -39.5 -28.6 -40.0 Indirect taxes 27.8 18.9 17.3 18.6 18.9 Direct taxes 52.6 55.8 51.0 50.0 54.3 Subsidies 10.3 11.9 9.1 8.8 7.6d. Based on data in table, calculate the following value for 201?, 2018, 2019. 2020 and 2021. 1. Gross domestic product at market price ii. Gross National product at market price iii. Gross National product at factor cost iv. National Income
Step by Step Solution
There are 3 Steps involved in it

Get step-by-step solutions from verified subject matter experts