

Question: Chapter 3 Assignment (20 pts) Software Assignment: 1. Construct a frequency table of the ages listed in Data Set below (Body Measurements Male). Use bins
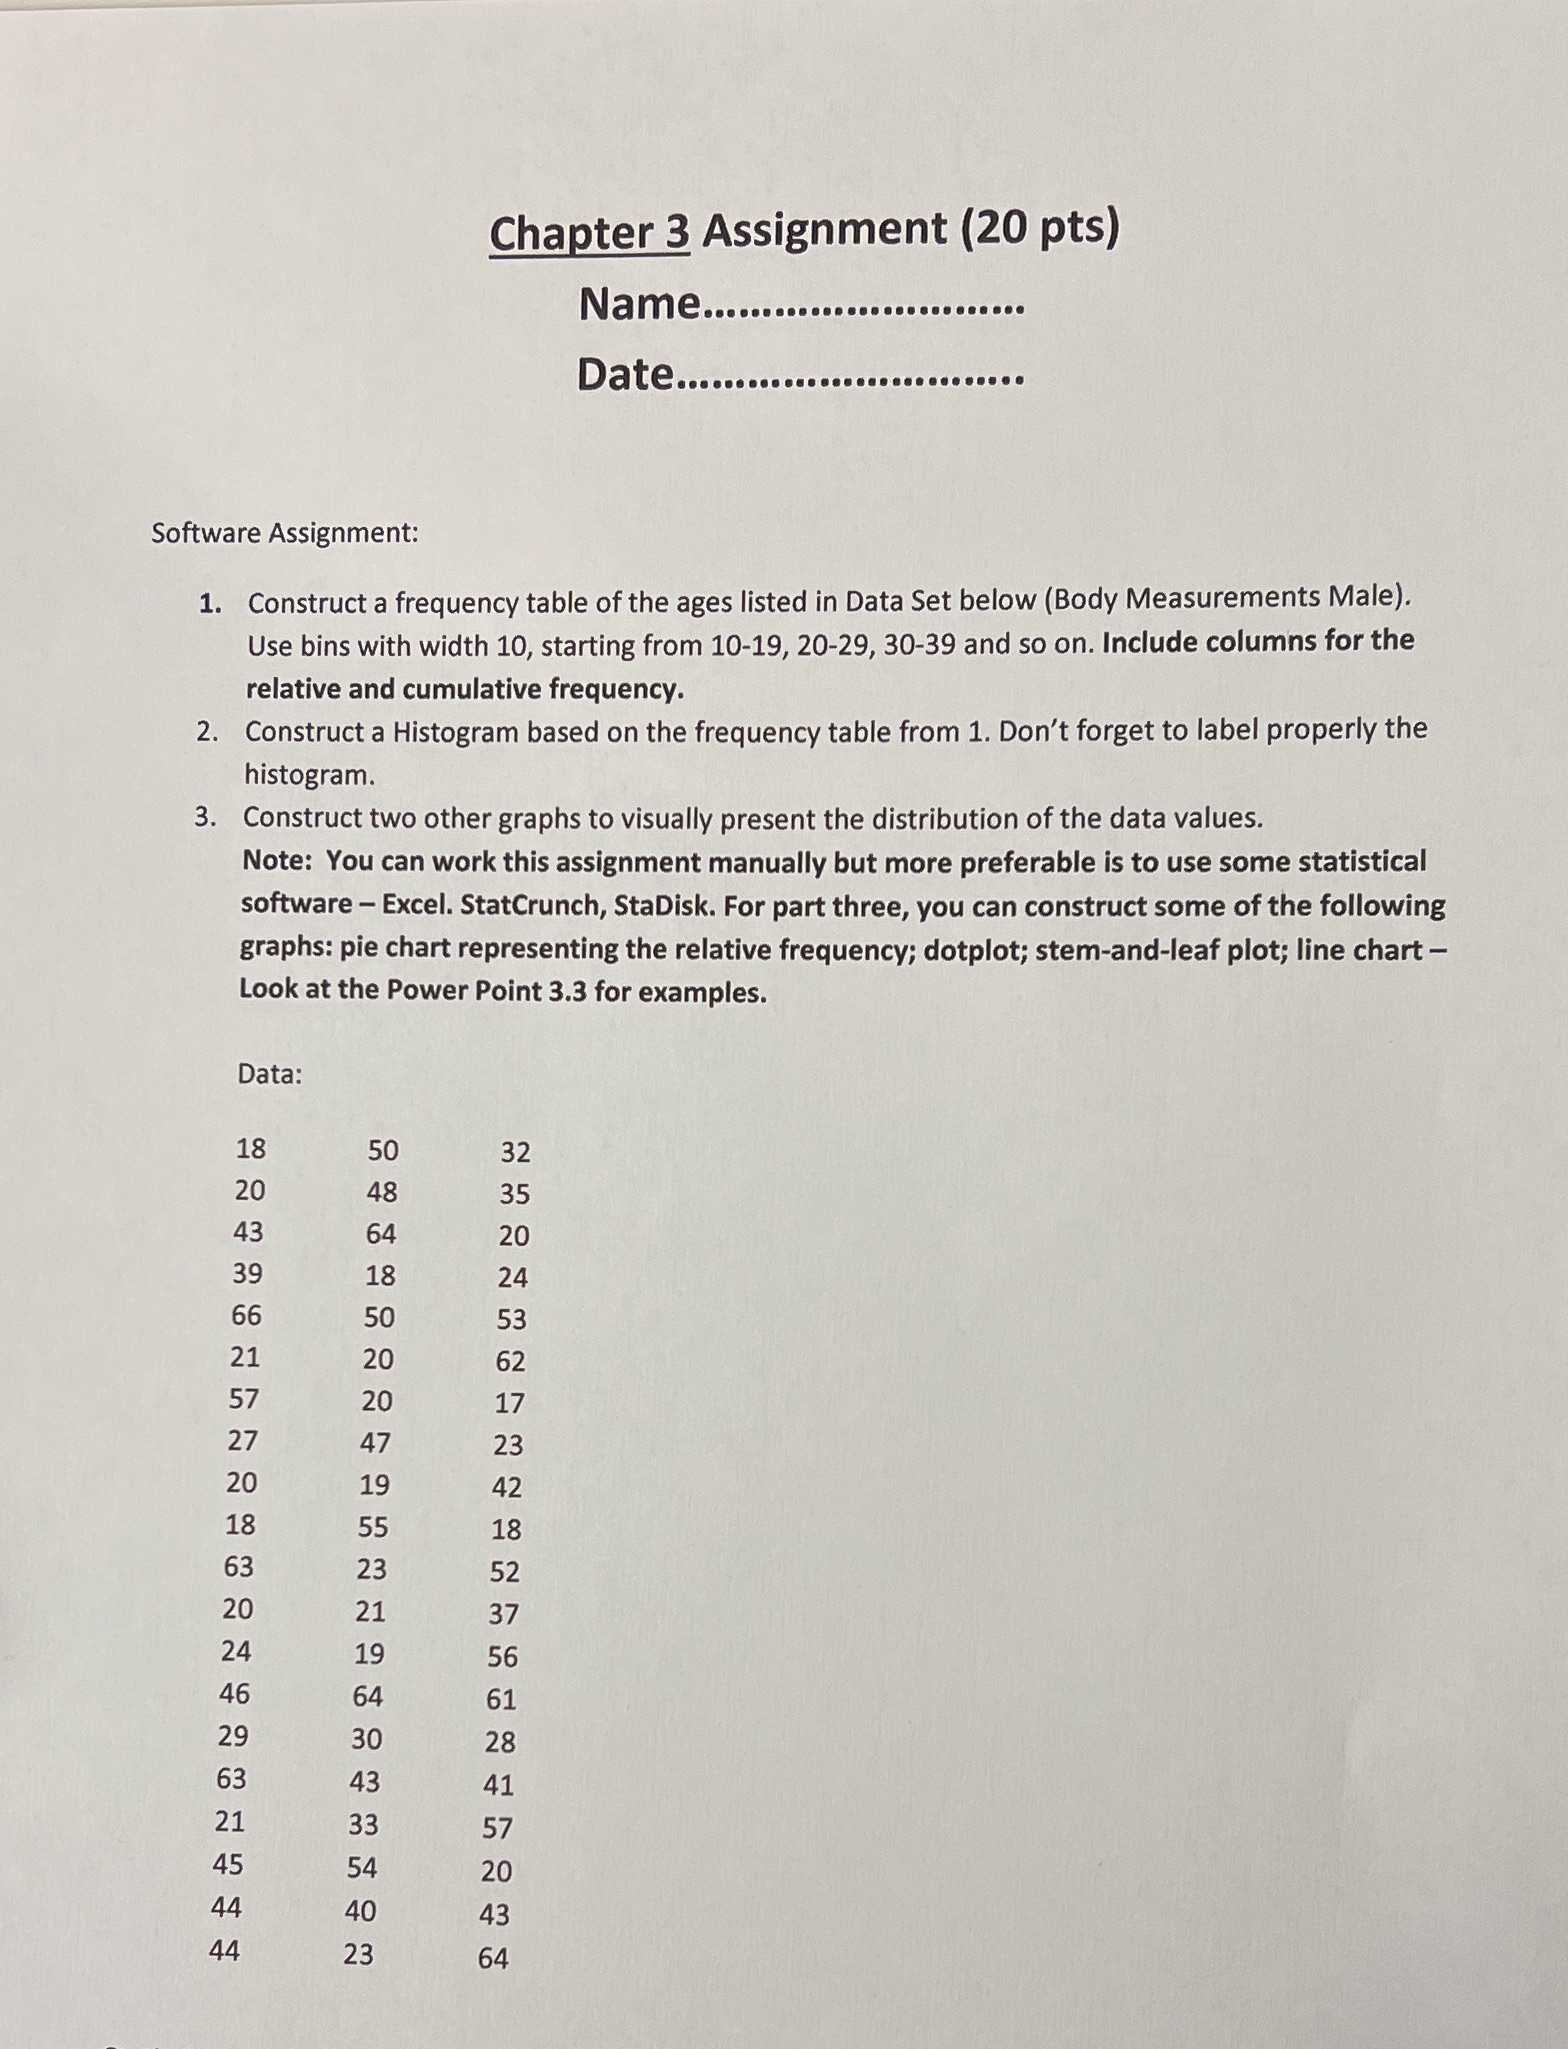
Chapter 3 Assignment (20 pts) Software Assignment: 1. Construct a frequency table of the ages listed in Data Set below (Body Measurements Male). Use bins with width 10, starting from 10-19, 20-29, 30-39 and so on. Include columns for the relative and cumulative frequency. 2. Construct a Histogram based on the frequency table from 1. Don't forget to label properly the histogram. Construct two other graphs to visually present the distribution of the data values. 3. Note: You can work this assignment manually but more preferable is to use some statistical software - Excel. StatCrunch, StaDisk. For part three, you can construct some of the following graphs: pie chart representing the relative frequency; dotplot; stem-and-leaf plot; line chart - Look at the Power Point 3.3 for examples. Data: 18 50 32 20 48 35 43 64 20 39 18 24 66 50 53 21 20 62 57 20 17 27 47 23 19 42 55 18 23 19 56 64 61 30 28 43 41 33 57 54 20 40 43 44 23 64
Step by Step Solution
There are 3 Steps involved in it

Get step-by-step solutions from verified subject matter experts