

Question: Chapter 3 - Forecasting Using the following data, IN EXCEL complete the chart similar to Example # 3 from our In - Class Problems and
Chapter Forecasting
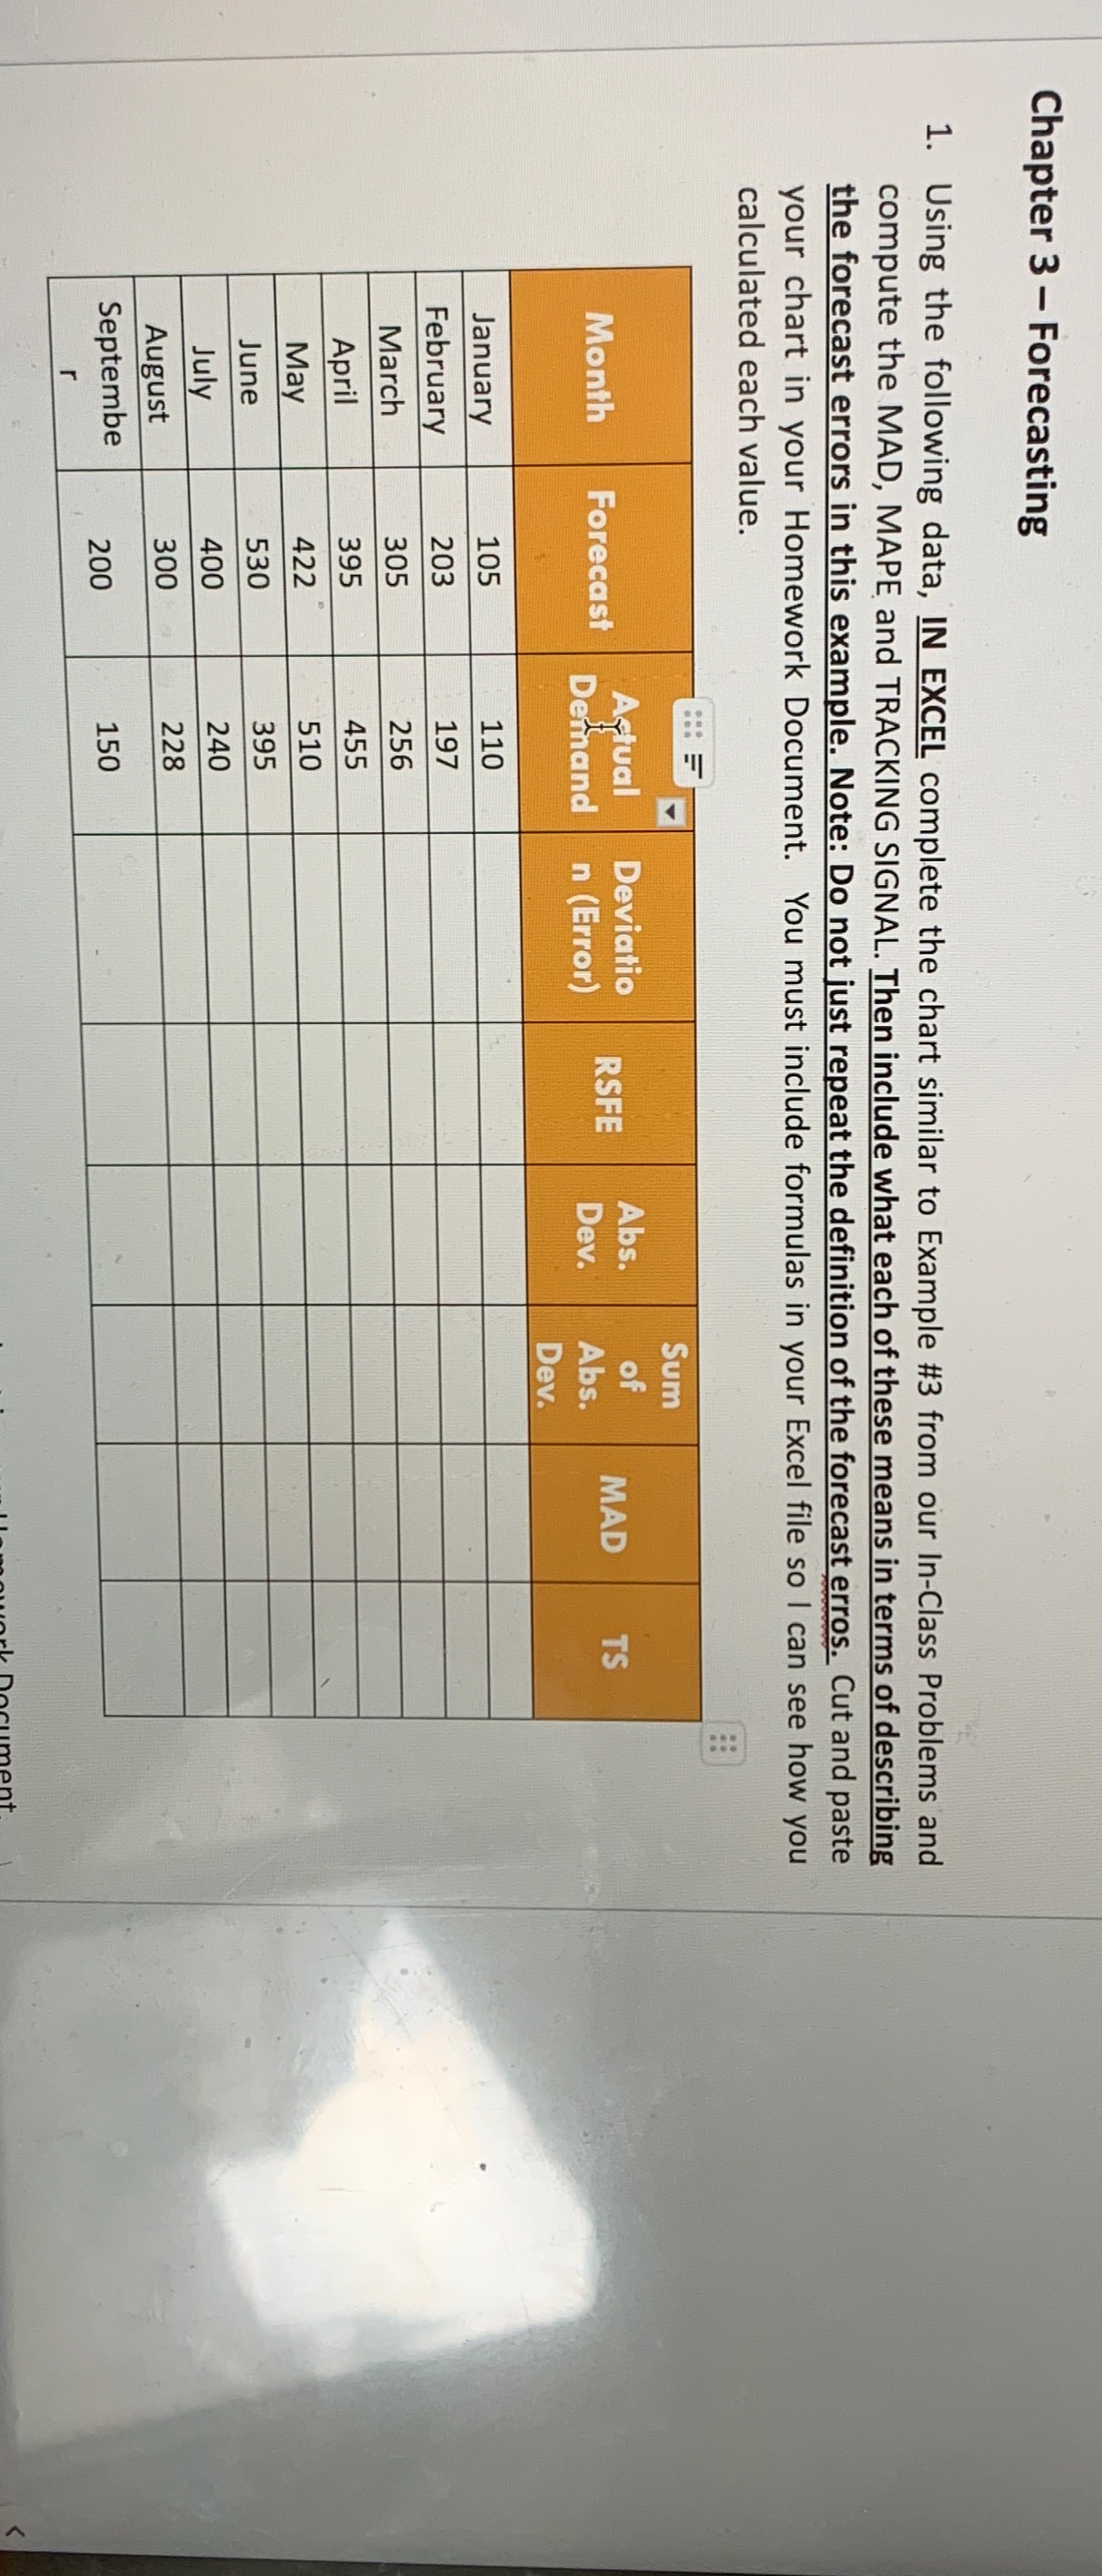
Using the following data, IN EXCEL complete the chart similar to Example # from our InClass Problems and compute the MAD, MAPE and TRACKING SIGNAL. Then include what each of these means in terms of describing the forecast errors in this example. Note: Do not just repeat the definition of the forecast erros. Cut and paste your chart in your Homework Document. You must include formulas in your Excel file so I can see how you calculated each value.
tableMonihForecest,tableAfualDethandtableDeviation FriorRSFE,tableAbsDevofAbsDevMAD,TSJanuaryFebruaryMarchAprilMayJuneJulyAugusttableSeptember
Step by Step Solution
There are 3 Steps involved in it
1 Expert Approved Answer
Step: 1 Unlock

Question Has Been Solved by an Expert!
Get step-by-step solutions from verified subject matter experts
Step: 2 Unlock
Step: 3 Unlock