

Question: ( Chapter 4 ) : Plot the following data in graph using excel sheet to determine the relationship between unit cost and size for the
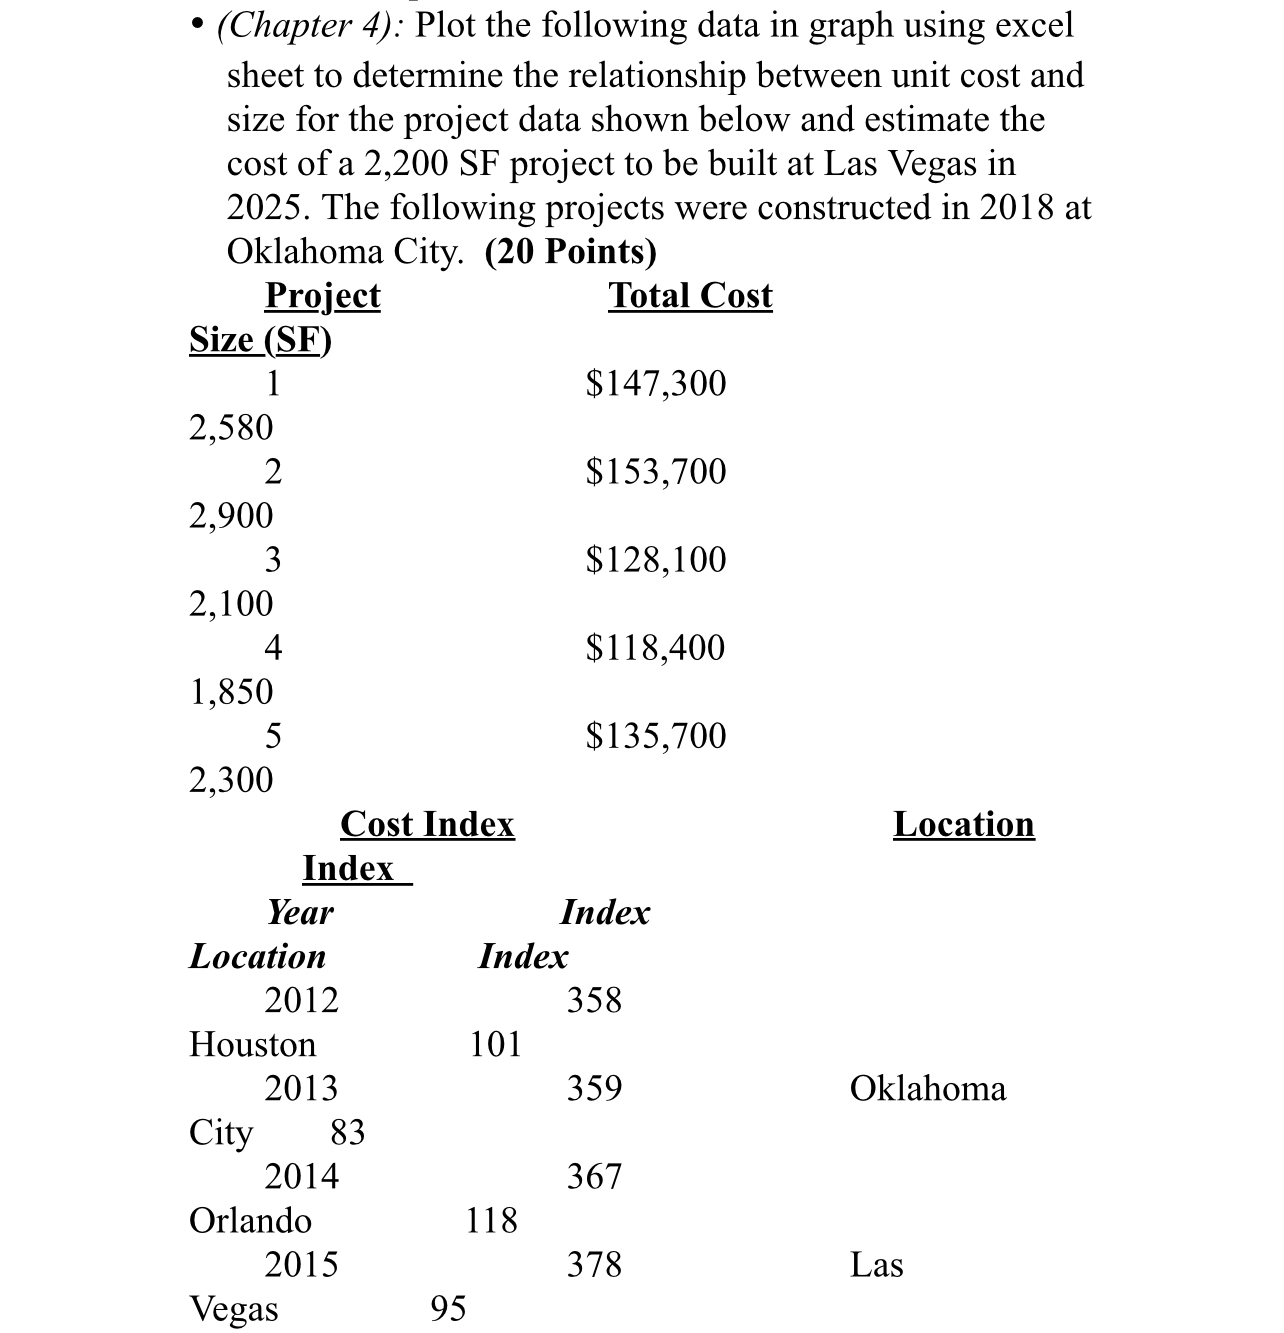
Chapter : Plot the following data in graph using excel
sheet to determine the relationship between unit cost and
size for the project data shown below and estimate the
cost of a SF project to be built at Las Vegas in
The following projects were constructed in at
Oklahoma City. Points
Step by Step Solution
There are 3 Steps involved in it
1 Expert Approved Answer
Step: 1 Unlock

Question Has Been Solved by an Expert!
Get step-by-step solutions from verified subject matter experts
Step: 2 Unlock
Step: 3 Unlock