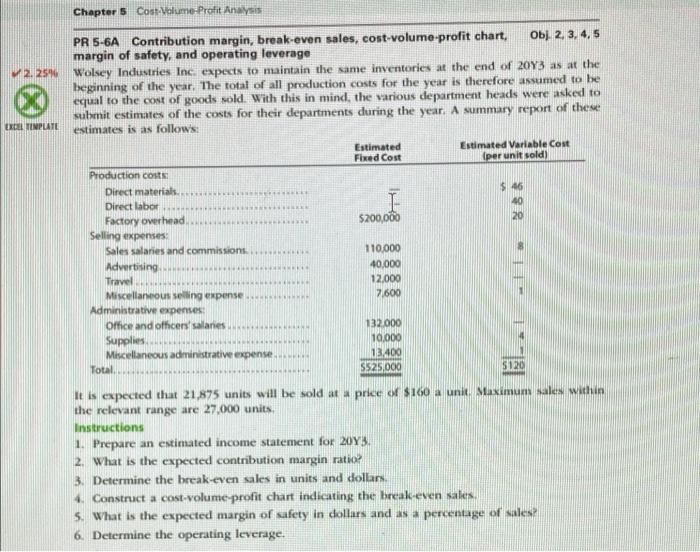
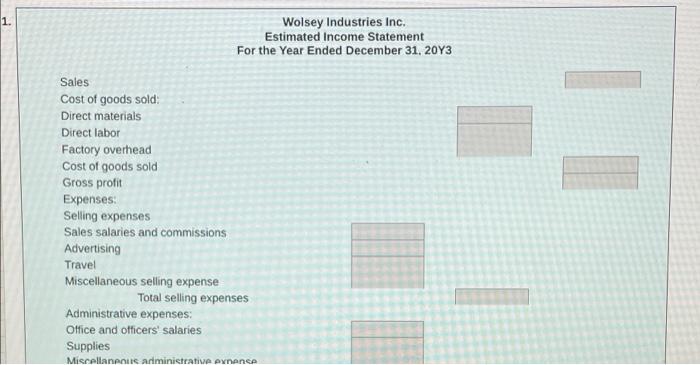
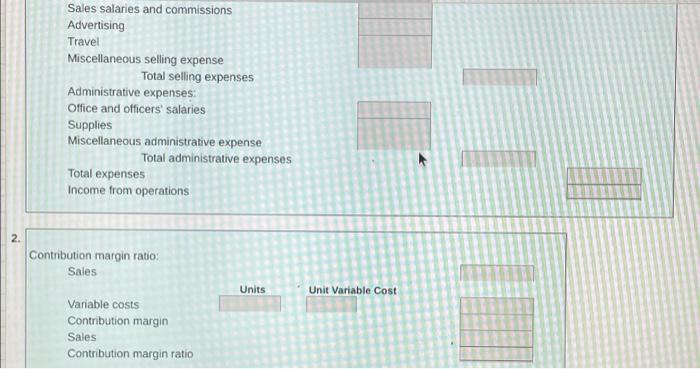
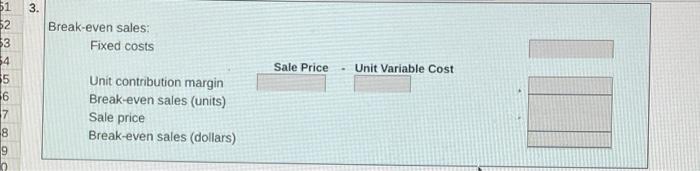
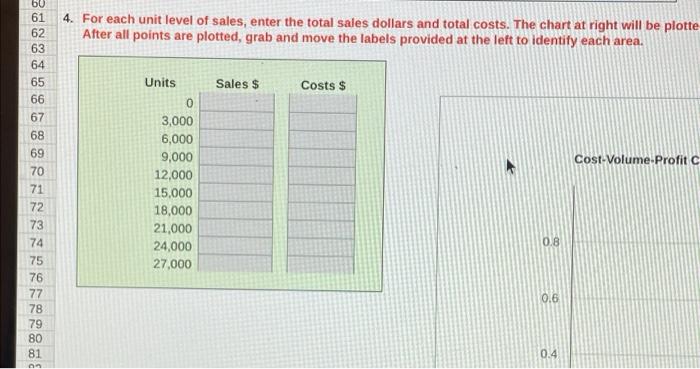
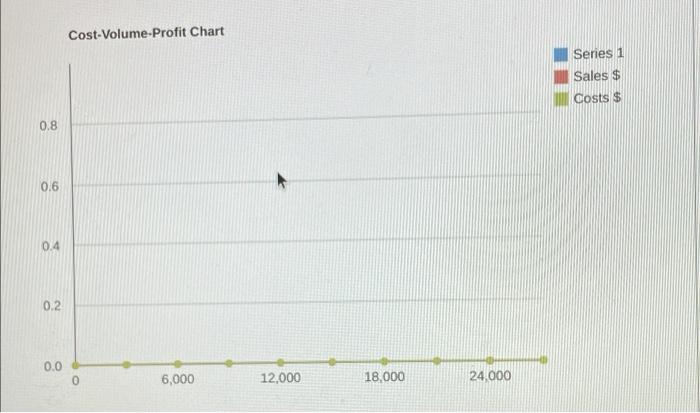
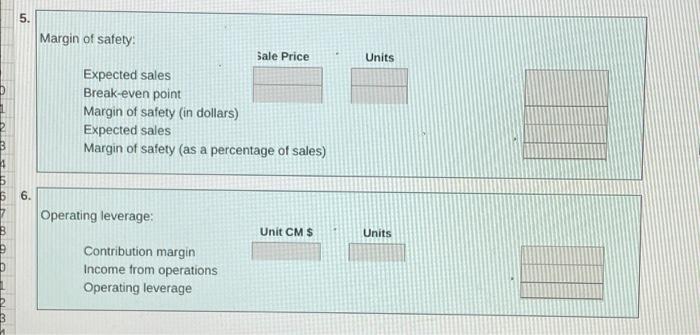
Chapter 5 Cost Volume-Profit Analysis PR 5-6A Contribution margin, break-even sales, cost-volume-profit chart, Obj. 2, 3, 4,5 margin of safety, and operating leverage 2.25% Wolsey Industries Inc. expects to maintain the same inventories at the end of 2013 as at the beginning of the year. The total of all production costs for the year is therefore assumed to be equal to the cost of goods sold. With this in mind, the various department heads were asked to submit estimates of the costs for their departments during the year. A summary report of these EL TEMPLATE estimates is as follows: Estimated Estimated Variable Cost Fixed Cost (per unit sold) Production costs Direct materials S46 Direct labor I Factory overhead $200,000 Selling expenses Sales salanes and commission 110,000 Advertising 40.000 Travel 12.000 Miscellaneousseling expense 7,600 Administrative expenses: Office and others salanes 132 000 Supplies 10.000 Miscellaneous administrative expense. 13.400 Total S525,000 $120 . It is expected that 21.875 units will be sold at a price of $160 a unit. Maximum sales within the relevant range are 27.000 units Instructions 1. Prepare an estimated income statement for 2015 2. What is the expected contribution margin ratio? 3. Determine the break-even sales in units and dollar 4. Construct a cost-volume-profit chart indicating the break-even sales 5. What is the expected margin of safety in dollars and as a percentage of sales 6. Determine the operating leverage. 1. Wolsey Industries Inc. Estimated Income Statement For the Year Ended December 31, 20Y3 Sales Cost of goods sold Direct materials Direct labor Factory overhead Cost of goods sold Gross profit Expenses: Selling expenses Sales salaries and commissions Advertising Travel Miscellaneous selling expense Total selling expenses Administrative expenses: Office and officers' salaries Supplies Miscellaneous administrative eynence Sales salaries and commissions Advertising Travel Miscellaneous selling expense Total selling expenses Administrative expenses Office and officers' salaries Supplies Miscellaneous administrative expense Total administrative expenses Total expenses Income from operations 2. Contribution margin ratio: Sales Units Unit Variable Cost Variable costs Contribution margin Sales Contribution margin ratio . 3. $1 52 Break-even sales: Fixed costs 54 Sale Price - Unit Variable Cost 5 6 7 00 NSN Unit contribution margin Break-even sales (units) Sale price Break-even sales (dollars) II 9 4. For each unit level of sales, enter the total sales dollars and total costs. The chart at right will be plotte After all points are plotted, grab and move the labels provided at the left to identify each area. 60 61 62 63 64 65 66 67 68 Sales $ Costs $ Cost-Volume-Profit C 69 70 71 72 73 74 75 76 77 78 79 Units 0 3,000 6,000 9,000 12,000 15,000 18,000 21,000 24,000 27,000 0.8 0.6 80 81 0.4 Cost-Volume-Profit Chart Series 1 Sales $ Costs $ 0.8 0.6 0.4 0.2 0.0 0 6,000 12,000 18,000 24.000 5. Units Margin of safety Sale Price Expected sales Break-even point Margin of safety (in dollars) Expected sales Margin of safety (as a percentage of sales) 6. Operating leverage: Unit CMS Units Contribution margin Income from operations Operating leverage


