

Question: Chapter 5, Problem 1: At the end of Chapter 3, we discussed T-S diagrams, and how the area enclosed within a T-S diagram corresponds to
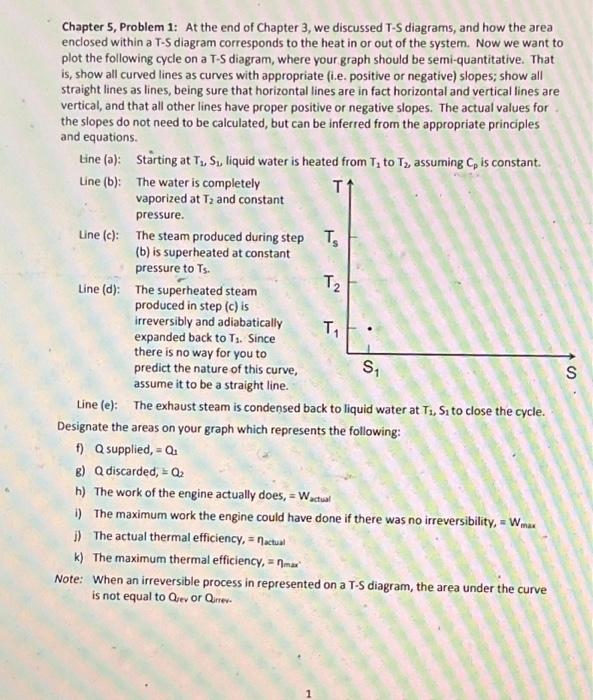
Chapter 5, Problem 1: At the end of Chapter 3, we discussed T-S diagrams, and how the area enclosed within a T-S diagram corresponds to the heat in or out of the system. Now we want to plot the following cycle on a T-S diagram, where your graph should be semi-quantitative. That is, show all curved lines as curves with appropriate (i.e. positive or negative) slopes; show all straight lines as lines, being sure that horizontal lines are in fact horizontal and vertical lines are vertical, and that all other lines have proper positive or negative slopes. The actual values for the slopes do not need to be calculated, but can be inferred from the appropriate principles and equations. Line (a): Starting at T1,S1, liquid water is heated from T2 to T2, assuming Cp is constant. Line (b): The water is completely vaporized at T2 and constant pressure. Line (c): The steam produced during step (b) is superheated at constant pressure to T5. Line (d): The superheated steam produced in step (c) is irreversibly and adiabatically expanded back to T1. Since there is no way for you to predict the nature of this curve, assume it to be a straight line. Line (e): The exhaust steam is condensed back to liquid water at T2,S1 to close the cycle. Designate the areas on your graph which represents the following: f) Q supplied, =Q1 g) Q discarded, =Q2 h) The work of the engine actually does, =Wactual i) The maximum work the engine could have done if there was no irreversibility, =Wmax j) The actual thermal efficiency, = Mactual k) The maximum thermal efficiency, =nmax ' Note: When an irreversible process in represented on a T-S diagram, the area under the curve is not equal to Qiev or Qurr
Step by Step Solution
There are 3 Steps involved in it

Get step-by-step solutions from verified subject matter experts