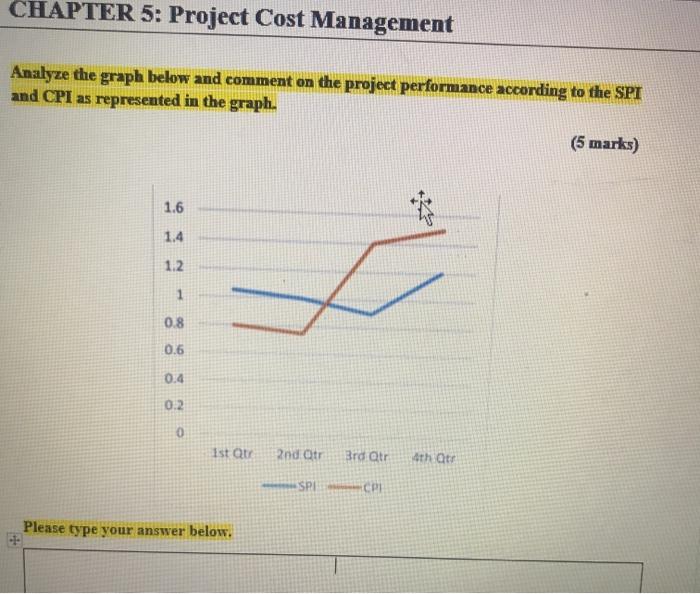
Question: CHAPTER 5: Project Cost Management Analyze the graph below and comment on the project performance according to the SPI and CPI as represented in the

CHAPTER 5: Project Cost Management Analyze the
CHAPTER 5: Project Cost Management Analyze the graph below and comment on the project performance according to the SPI and CPI as represented in the graph. (5 marks) 1.6 1.4 1.2 1 0.8 0.6 0.4 0.2 0 Ist at 2nd Otr Brd Otr that SPICPI Please type your answer below. Styles Practical Question. (5 marks) Suppose you are managing a software development project. The project is expected to be completed in 8 months at a cost of $10000 per month. After 2 months, you realize that the project is 30% completed at a cost of $40,000. What is the Earned Value (EV) and the Cost Variance (CY)? SOLUTION

Step by Step Solution

There are 3 Steps involved in it

1 Expert Approved Answer
Step: 1 Unlock blur-text-image
Question Has Been Solved by an Expert!

Get step-by-step solutions from verified subject matter experts

Step: 2 Unlock
Step: 3 Unlock

Students Have Also Explored These Related General Management Questions!