

Question: Analyze the graph below and comment on the project performance according to the SPI and CPI as represented in the graph (don t copy other
Analyze the graph below and comment on the project performance according to the SPI and CPI as represented in the graph
(don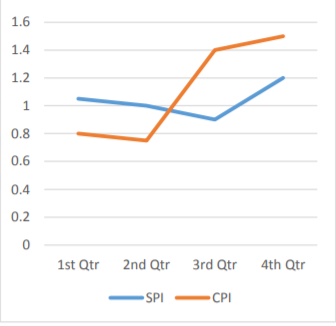 t copy other answers)
1.6 1.4 1.2 so 1 0.8 0.6 0.4 0.2 0 1st Qtr 2nd Qtr 3rd Qtr 4th Qtr SPI CPI
Step by Step Solution
There are 3 Steps involved in it
1 Expert Approved Answer
Step: 1 Unlock

Question Has Been Solved by an Expert!
Get step-by-step solutions from verified subject matter experts
Step: 2 Unlock
Step: 3 Unlock