

Question: Chapter 5-Homework Calculator ook Print Item Identify Cost Graphs The following cost graphs illustrate various types of cost behavior: Cost Graph One Cost Graph Two
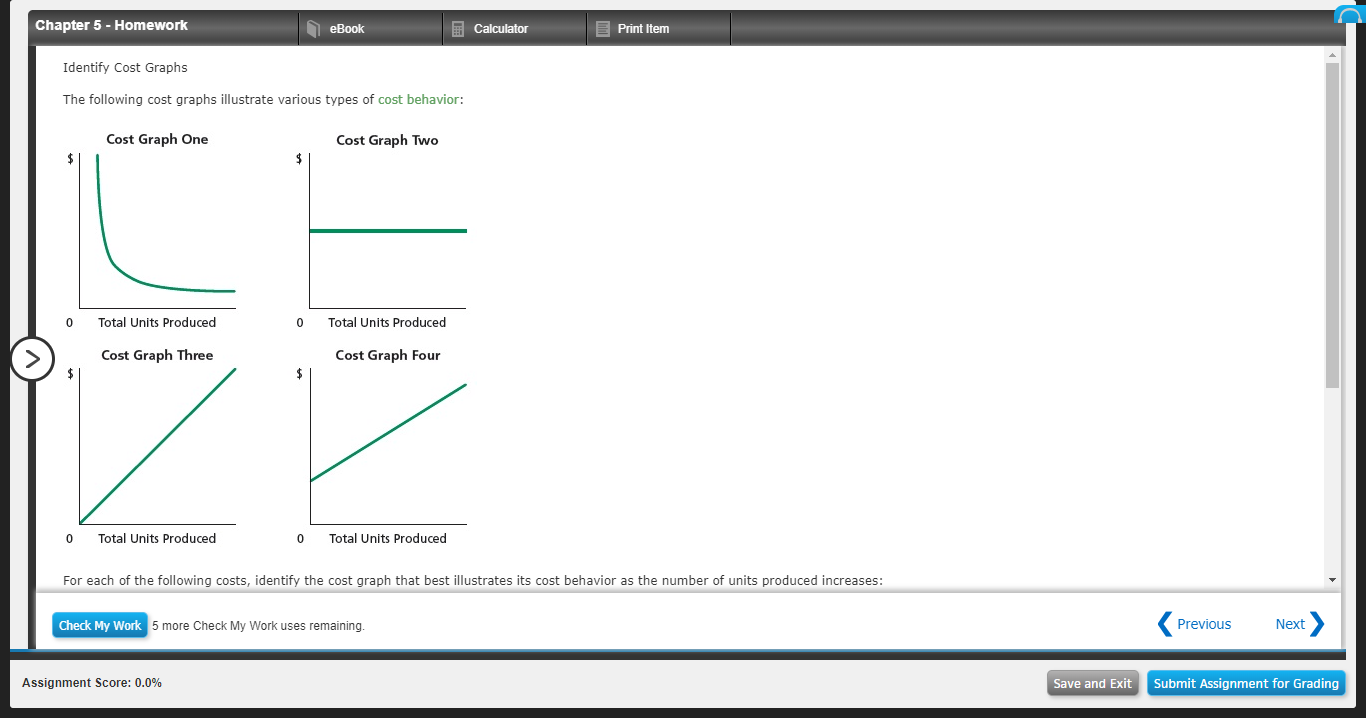
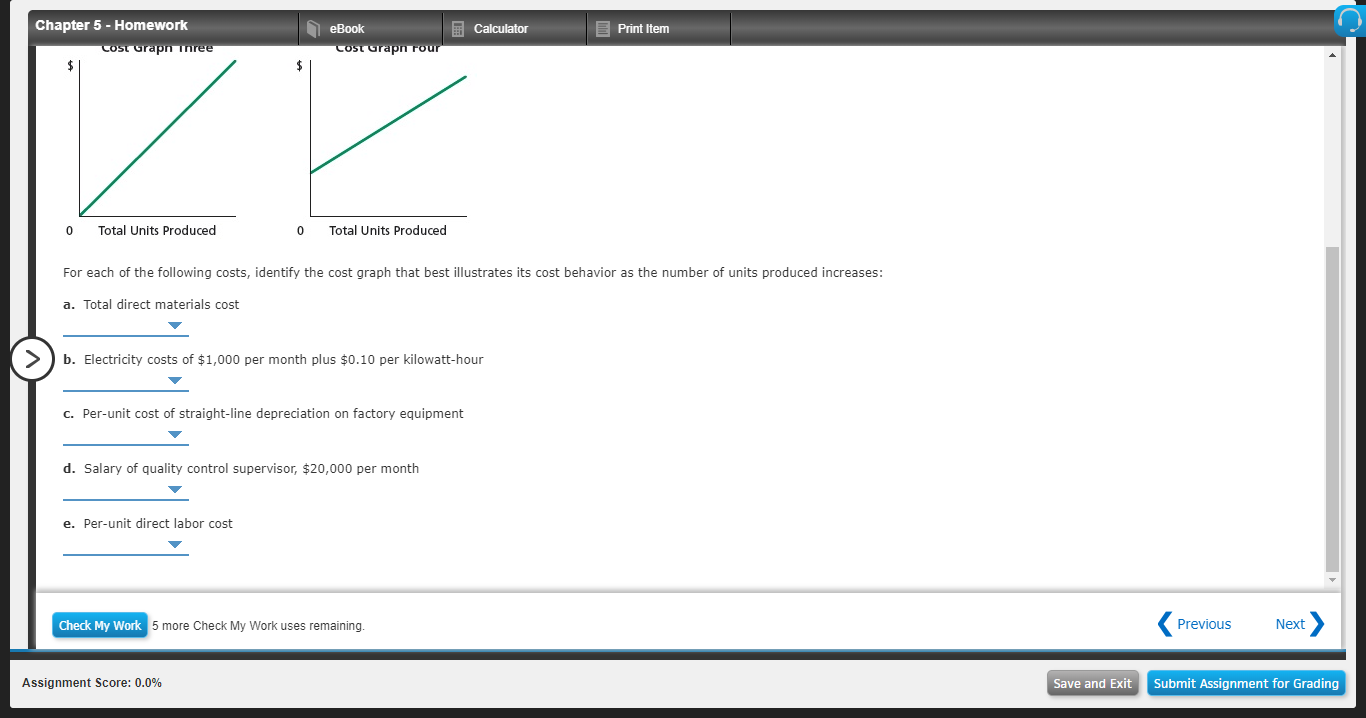
Chapter 5-Homework Calculator ook Print Item Identify Cost Graphs The following cost graphs illustrate various types of cost behavior: Cost Graph One Cost Graph Two $ Total Units Produced Total Units Produced Cost Graph Three Cost Graph Four $ Total Units Produced Total Units Produced 0 For each of the following costs, identify the cost graph that best illustrates its cost behavior as the number of units produced increases: Check My Work 5 more Check My Work uses remaining. Previous Next Submit Assignment for Grading Assignment Score: 0.0% Save and Exit Chapter 5- Homework eBook Calculator Print Item Cost Grapn Inree Cost Grapn rour Total Units Produced Total Units Produced 0 For each of the following costs, identify the cost graph that best illustrates its cost behavior as the number of units produced increases: a. Total direct materials cost b. Electricity costs of $1,000 per month plus $0.10 per kilowatt-hour c. Per-unit cost of straight-line depreciation on factory equipment d. Salary of quality control supervisor, $20,000 per month e. Per-unit direct labor cost Check My Work 5 more Check My Work uses remaining. Previous Next Submit Assignment for Grading Assignment Score: 0.0% Save and Exit
Step by Step Solution
There are 3 Steps involved in it

Get step-by-step solutions from verified subject matter experts