

Question: Identify Cost Graphs The following cost graphs illustrate various types of cost behavior: Cost Graph One Cost Graph Two 0 Total Units Produced Total Units
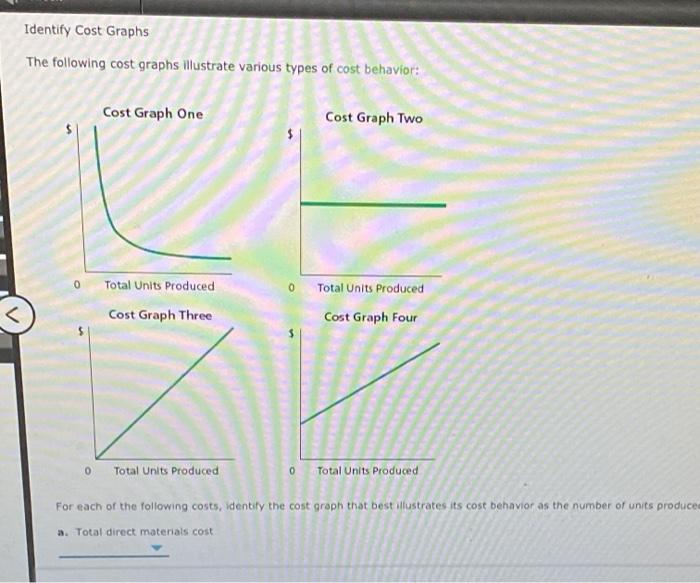
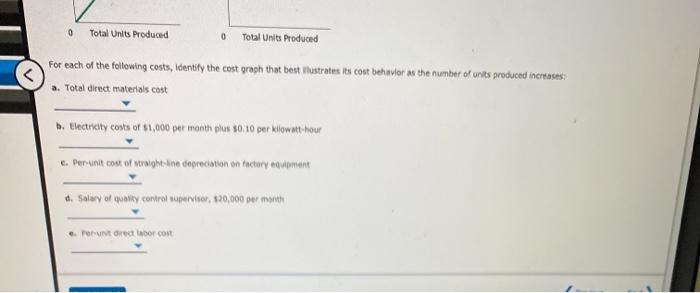
Identify Cost Graphs The following cost graphs illustrate various types of cost behavior: Cost Graph One Cost Graph Two 0 Total Units Produced Total Units Produced Cost Graph Three Cost Graph Four 0 Total Units Produced 0 Total Units Produced For each of the following costs, Identity the cost graph that bestillustrates its cost behavior as the number of units produce a. Total direct materials cost 0 Total Units Produced 0 Total Units Produced For each of the following costs, identify the cost graph that best thustrates its cost behavior as the number of units produced increases: a. Total direct materials cost b. Electricity costs of $1,000 per month plus 50:40 per kilowatt-hour c. Per-unit cost of straight; ne depreciation on factory equipment 4. Salary or quality control supervisor, $20.000 per month Portret borot
Step by Step Solution
There are 3 Steps involved in it

Get step-by-step solutions from verified subject matter experts