

Question: Chapter 6, Problem 1MC 48 Bookmarks) Show all steps: Ncte: Although not absclutely necessary, you are advised to use a conputer spreadsheet to work the
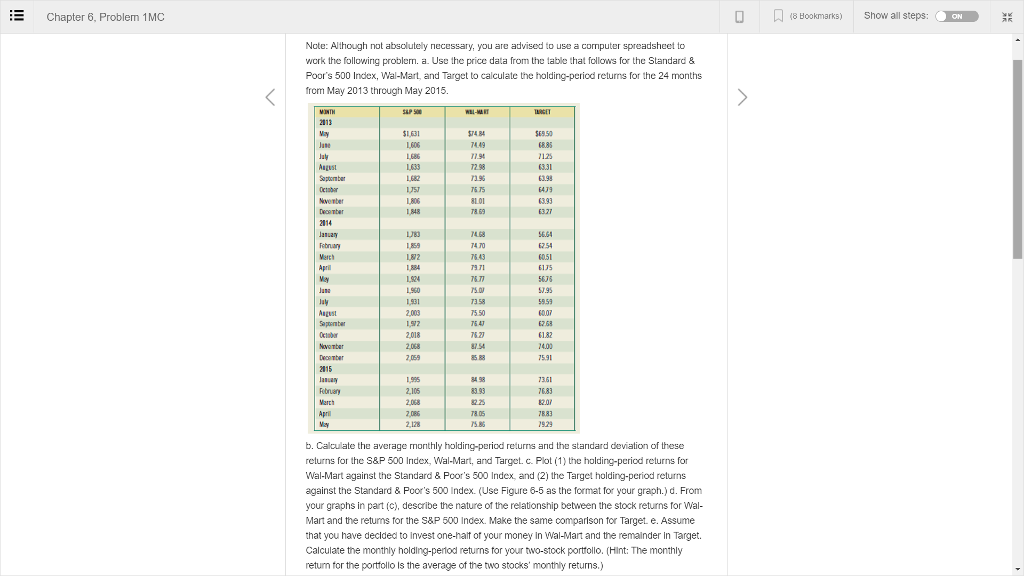
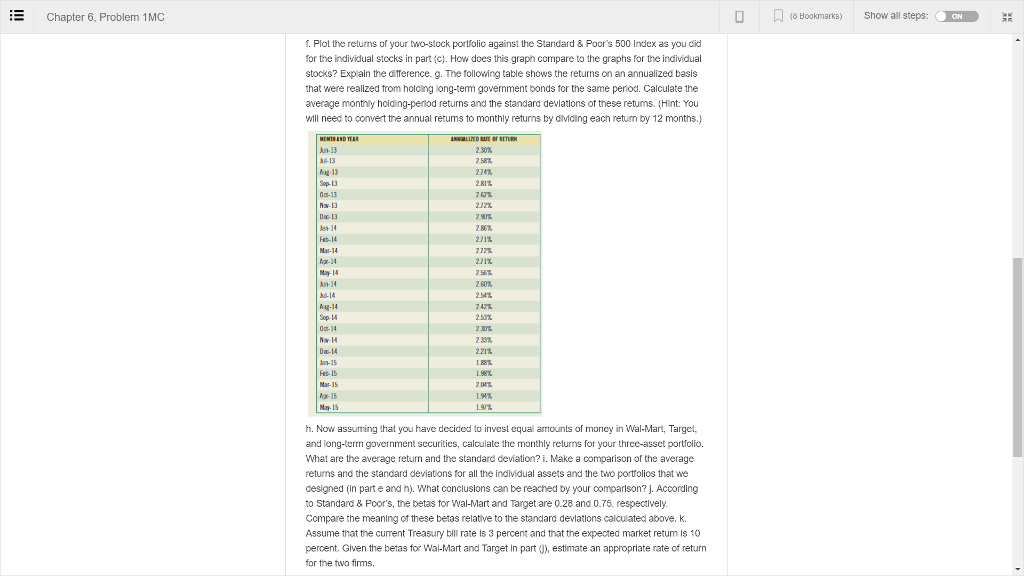
Chapter 6, Problem 1MC 48 Bookmarks) Show all steps: Ncte: Although not absclutely necessary, you are advised to use a conputer spreadsheet to work the following problern. a. Use the price data from the table that follows for the Standard & Poor's 500 Index, Wal-Mart and Target to calculate the holding-perid returns for the 24 months from May 2013 through May 2015. -MART 2113 $1,631 74.84 4.49 7.9 2.98 396 T6 T5 LOI 885 3.31 3.93 T4 70 76.43 79! 6754 884 61JS 56 1.95 5.50 763 1.82 2.068 7.54 85 88 75.91 2115 3 93 7683 T8 05 2,128 b. Calculate the average monthly holdirig-period returns and the standard deviation of these returns for the S&P 500 Index, Wal-Mart, and Target. c. Plot (1) the holding-pericd returns for Wal-Mart against the Standard & Pcor's 500 Index, and (2) the Target holding-period returns against the Standard & Poors 500 Index. (Use Figure 6-5 as the format for your graph.) d. From your graphs in part (c), describe the nature of the relationship between the stock returns for Wal- Mart and the returms for the S&P 500 Index. Make the same comparison for Target e. Assume that you have declded to Invest one-hait of your money In Wal-Mart and the remainder In Target. Calculate the monthly holding-period returns for your two-stock porttollo. (Hint: The monthly retun for the porttollo is the average of the two stocks' monthly returns.) Chapter 6, Problem 1MC 48 Bookmarks) Show all steps: Ncte: Although not absclutely necessary, you are advised to use a conputer spreadsheet to work the following problern. a. Use the price data from the table that follows for the Standard & Poor's 500 Index, Wal-Mart and Target to calculate the holding-perid returns for the 24 months from May 2013 through May 2015. -MART 2113 $1,631 74.84 4.49 7.9 2.98 396 T6 T5 LOI 885 3.31 3.93 T4 70 76.43 79! 6754 884 61JS 56 1.95 5.50 763 1.82 2.068 7.54 85 88 75.91 2115 3 93 7683 T8 05 2,128 b. Calculate the average monthly holdirig-period returns and the standard deviation of these returns for the S&P 500 Index, Wal-Mart, and Target. c. Plot (1) the holding-pericd returns for Wal-Mart against the Standard & Pcor's 500 Index, and (2) the Target holding-period returns against the Standard & Poors 500 Index. (Use Figure 6-5 as the format for your graph.) d. From your graphs in part (c), describe the nature of the relationship between the stock returns for Wal- Mart and the returms for the S&P 500 Index. Make the same comparison for Target e. Assume that you have declded to Invest one-hait of your money In Wal-Mart and the remainder In Target. Calculate the monthly holding-period returns for your two-stock porttollo. (Hint: The monthly retun for the porttollo is the average of the two stocks' monthly returns.)
Step by Step Solution
There are 3 Steps involved in it

Get step-by-step solutions from verified subject matter experts