

Question: Chapter 8 Worksheet Problem Please refer to the Excel file Ch 08 Red Tomato Tools for the following problem. Given the data provided in Table
Chapter 8 Worksheet Problem
Please refer to the Excel file Ch 08 Red Tomato Tools for the following problem. Given the data provided in Table 8-2 and Table 8-3 for Red Tomato Tools, use the Excel model to determine the optimal aggregate plan for the planning horizon. There is a requirement for no stockouts at the end of June and at least 500 units in inventory. What are the total cost, revenue, and profit for this plan?
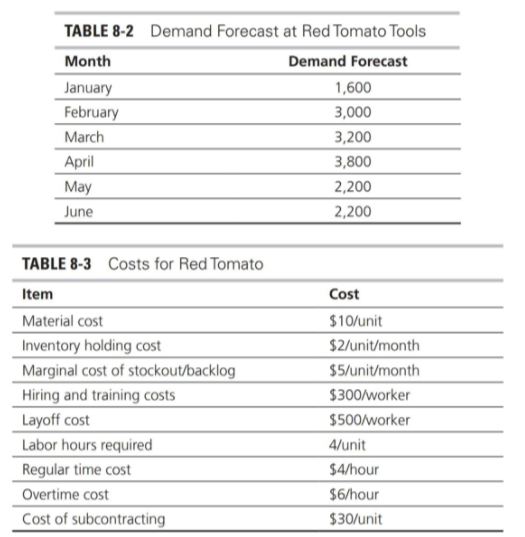
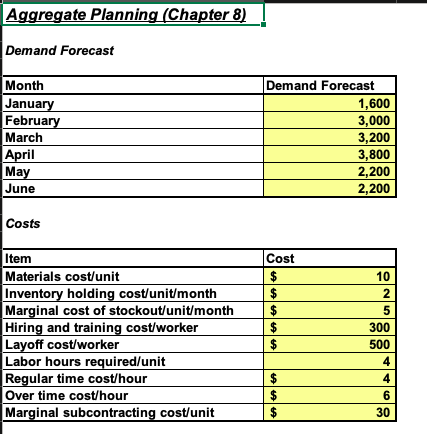
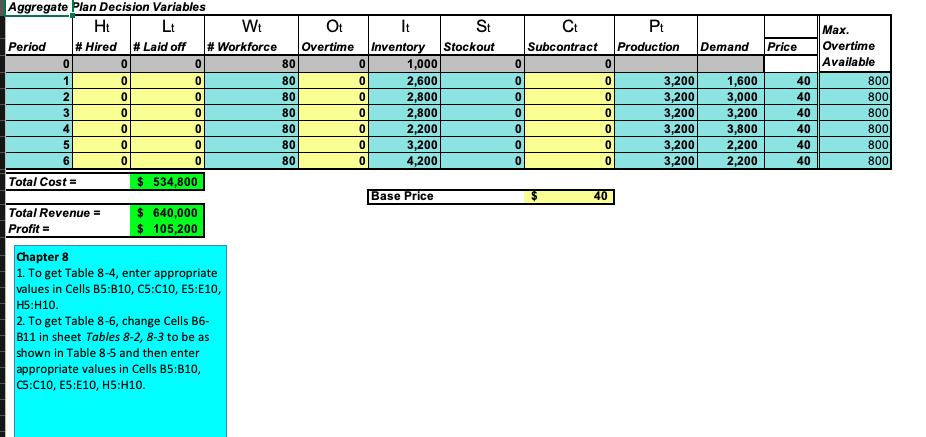
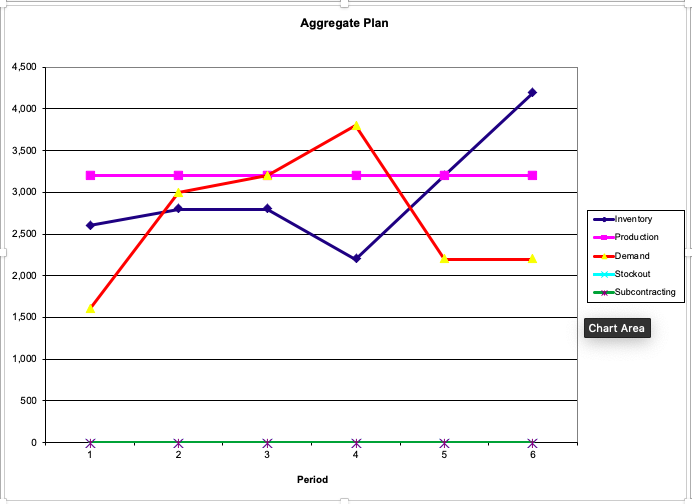
TABLE 8-2 Demand Forecast at Red Tomato Tools Month Demand Forecast January 1,600 February 3,000 March 3,200 3,800 May 2,200 June 2,200 April TABLE 8-3 Costs for Red Tomato Item Material cost Inventory holding cost Marginal cost of stockout/backlog Hiring and training costs Layoff cost Labor hours required Regular time cost Overtime cost Cost of subcontracting Cost $10/unit $2/unit/month $5/unit/month $300/worker $500/worker 4/unit $4/hour $6/hour $30/unit Aggregate Planning (Chapter 8) Demand Forecast Month January February March April May June Demand Forecast 1,600 3.000 3,200 3,800 2,200 2,200 Costs Cost Item Materials cost/unit Inventory holding cost/unit/month Marginal cost of stockout/unit/month Hiring and training cost/worker Layoff cost/worker Labor hours required/unit Regular time cost/hour Over time cost/hour Marginal subcontracting cost/unit 30 Aggregate Plan Decision Variables t Lt W t Period # Hired # Laid off # Workforce 80 Ot Overtime St Stockout Ct Subcontract Production Demand Price 40 It Inventory 1,000 2,600 2,800 2,800 2,200 3,200 4,200 3,200 3,200 3,200 3,200 3,200 3,200 1,600 3,000 3,200 3,800 2,200 2,200 40 40 40 40 . Overtime Available 800 800 800 800 800 800 0 40 Total Cost = $ 534,800 Base Price 40 Total Revenue = Profit = $ 640,000 $ 105,200 Chapter 8 1. To get Table 8-4, enter appropriate values in Cells B5:B10, CS:C10, E5:E10, H5:H10. 2. To get Table 8-6, change Cells B6- B11 in sheet Tables 8-2, 8-3 to be as shown in Table 8-5 and then enter appropriate values in Cells B5:B10, CS:C10, E5:E10, H5:H10. Aggregate Plan 4,500 4,000 3,500 3,000 Inventory 2,500 Production - Demand 2,000 Stockout Subcontracting 1,500 Chart Area Period TABLE 8-2 Demand Forecast at Red Tomato Tools Month Demand Forecast January 1,600 February 3,000 March 3,200 3,800 May 2,200 June 2,200 April TABLE 8-3 Costs for Red Tomato Item Material cost Inventory holding cost Marginal cost of stockout/backlog Hiring and training costs Layoff cost Labor hours required Regular time cost Overtime cost Cost of subcontracting Cost $10/unit $2/unit/month $5/unit/month $300/worker $500/worker 4/unit $4/hour $6/hour $30/unit Aggregate Planning (Chapter 8) Demand Forecast Month January February March April May June Demand Forecast 1,600 3.000 3,200 3,800 2,200 2,200 Costs Cost Item Materials cost/unit Inventory holding cost/unit/month Marginal cost of stockout/unit/month Hiring and training cost/worker Layoff cost/worker Labor hours required/unit Regular time cost/hour Over time cost/hour Marginal subcontracting cost/unit 30 Aggregate Plan Decision Variables t Lt W t Period # Hired # Laid off # Workforce 80 Ot Overtime St Stockout Ct Subcontract Production Demand Price 40 It Inventory 1,000 2,600 2,800 2,800 2,200 3,200 4,200 3,200 3,200 3,200 3,200 3,200 3,200 1,600 3,000 3,200 3,800 2,200 2,200 40 40 40 40 . Overtime Available 800 800 800 800 800 800 0 40 Total Cost = $ 534,800 Base Price 40 Total Revenue = Profit = $ 640,000 $ 105,200 Chapter 8 1. To get Table 8-4, enter appropriate values in Cells B5:B10, CS:C10, E5:E10, H5:H10. 2. To get Table 8-6, change Cells B6- B11 in sheet Tables 8-2, 8-3 to be as shown in Table 8-5 and then enter appropriate values in Cells B5:B10, CS:C10, E5:E10, H5:H10. Aggregate Plan 4,500 4,000 3,500 3,000 Inventory 2,500 Production - Demand 2,000 Stockout Subcontracting 1,500 Chart Area Period
Step by Step Solution
There are 3 Steps involved in it

Get step-by-step solutions from verified subject matter experts