

Question: Tables 8-2, 8-3 Aggregate Planning (Chapter 8) Demand Forecast Month Demand Forecast January 1,600 February 3,000 March 3,200 April 3,800 May 2,200 June 2,200 Costs
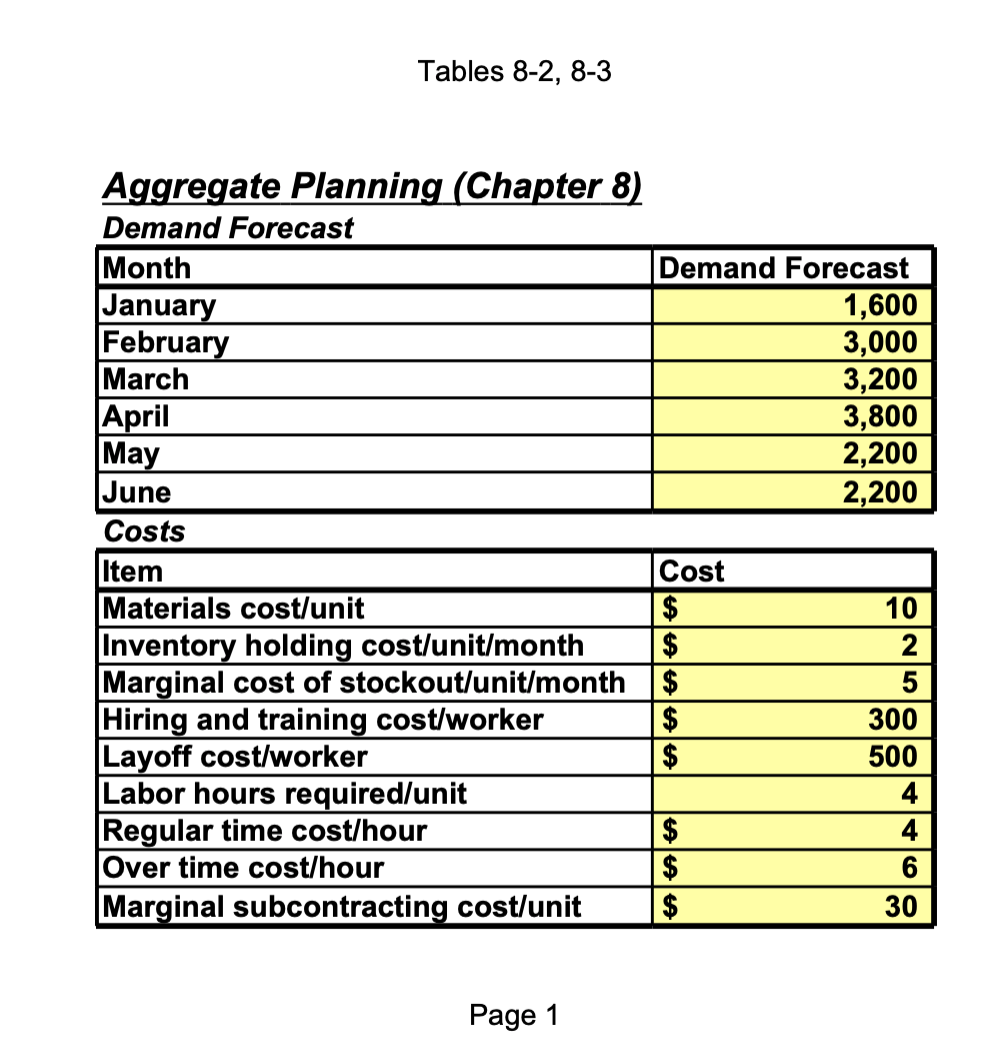
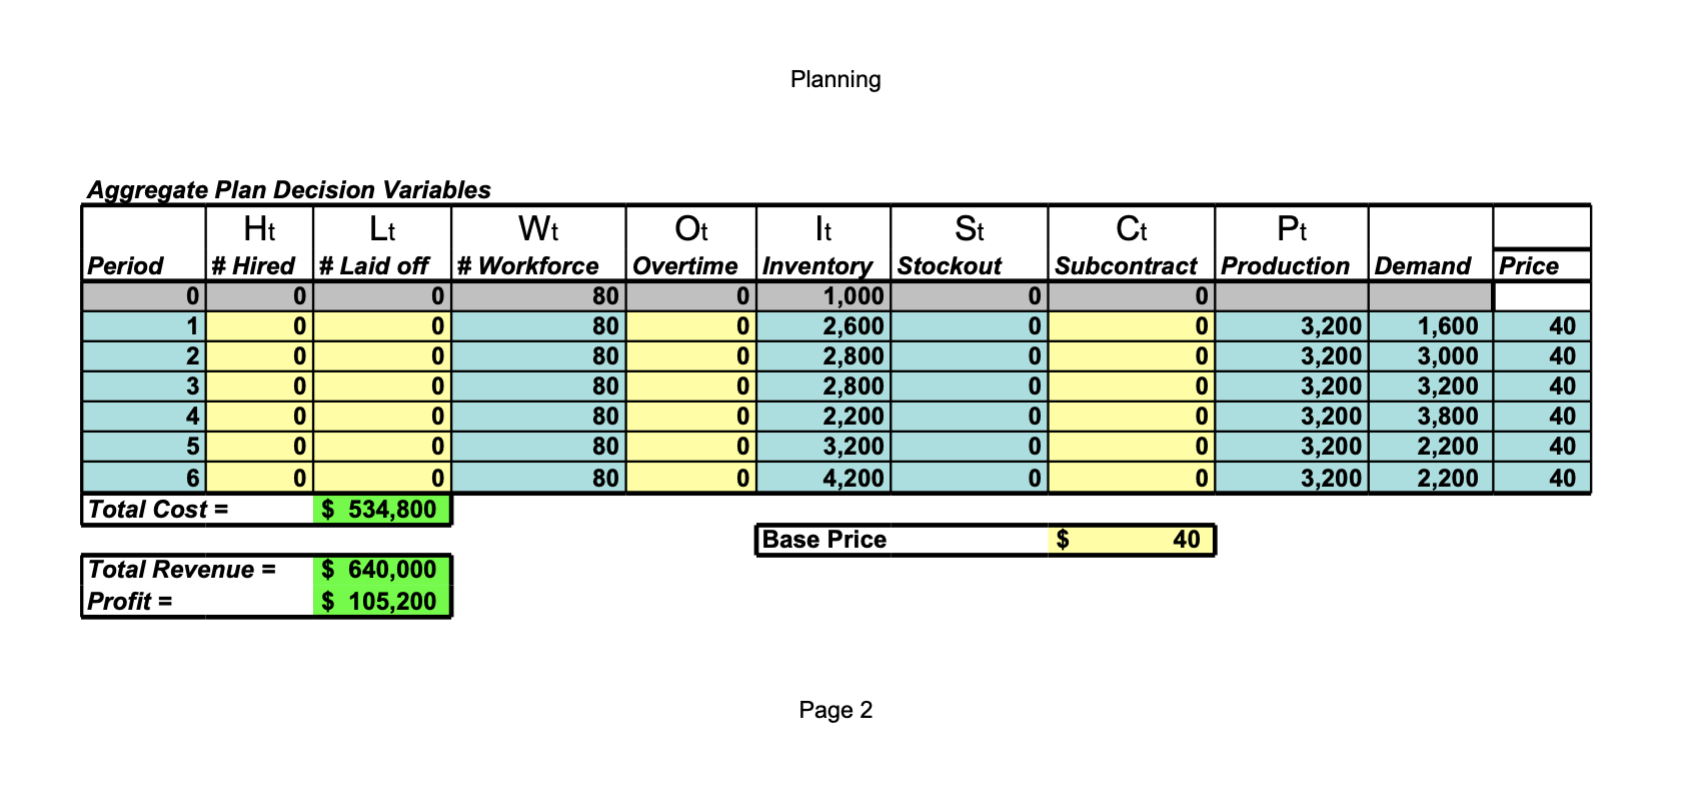
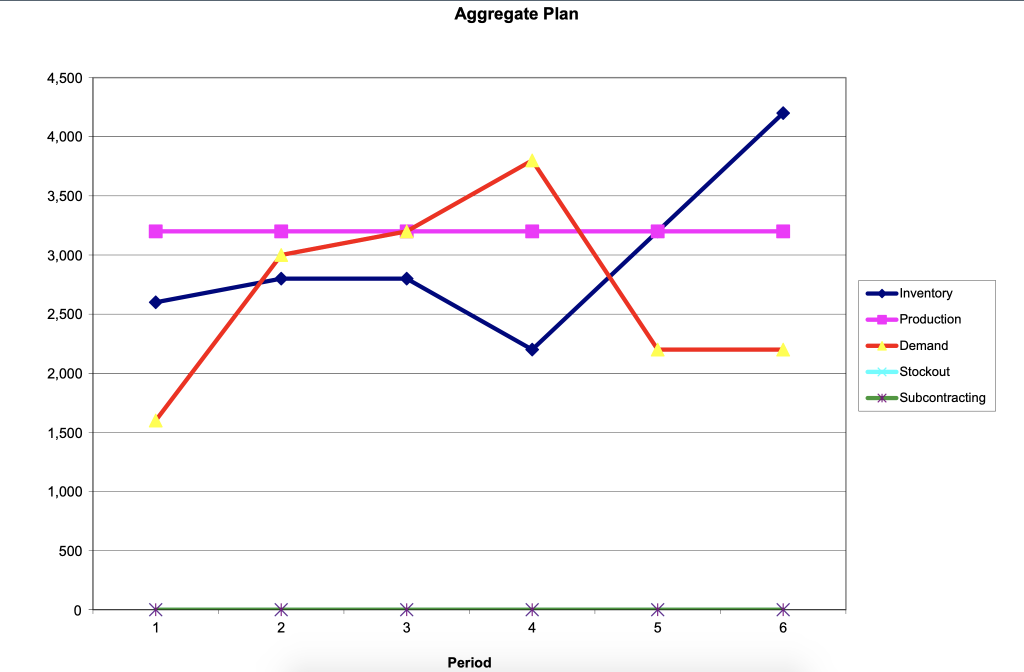
Tables 8-2, 8-3 Aggregate Planning (Chapter 8) Demand Forecast Month Demand Forecast January 1,600 February 3,000 March 3,200 April 3,800 May 2,200 June 2,200 Costs Item Cost Materials cost/unit $ 10 Inventory holding cost/unit/month $ 2 Marginal cost of stockout/unit/month $ 5 Hiring and training cost/worker $ 300 Layoff cost/worker $ 500 Labor hours required/unit 4 Regular time cost/hour $ 4 Over time cost/hour $ 6 Marginal subcontracting cost/unit $ 30 AAA Page 1 Planning Polo Aggregate Plan Decision Variables Ht Lt Wt Ot It St Period # Hired # Laid off # Workforce Overtime Inventory Stockout 0 0 0 80 1,000 1 0 0 80 2,600 2 0 0 80 0 2,800 3 0 0 80 0 2,800 4 0 0 80 0 2,200 5 0 0 80 0 3,200 6 0 0 80 0 4,200 Total Cost = $ 534,800 Base Price Total Revenue = $ 640,000 Profit = $ 105,200 Ct Pt Subcontract Production Demand Price 0 0 0 0 3,200 1,600 40 0 0 3,200 3,000 40 0 0 3,200 3,200 40 0 0 3,200 3,800 40 0 0 3,200 2,200 40 0 0 3,200 2,200 40 $ 40 Page 2 Aggregate Plan 4,500 4,000 3,500 X t 3,000 Inventory 2,500 Production --Demand 2,000 - Stockout *Subcontracting 1,500 1,000 500 0 * 1 * 2 * 3 * 4 5 * 6 Period Assignment 2021-10-05(a) MGT 350 Supply Chain Management Due: 5 OCT 2021 Design a format that you use to submit (via Canvas) your response to the following study questions. It is to be professional in appearance and organized clearly. Provide a concise response (no more than 250 words) to the exercise question below. Include the appropriate spreadsheet results in your response submitted to Canvas. Please refer to the Excel file Ch 08 Red Tomato Tools for the following problem. Be sure to bring hardcopy of your work to class, or your personal device to electronically access it, so you will be able to fully participate in the class discussion. Re.: Chopra, S. (2019) Supply Chain Management: Strategy, Planning, and Operation, 7th Ed. New York, NY: Pearson. Chapter 8 Worksheet Problem Given the data provided in Table 8-2 and Table 8-3 for Red Tomato Tools, use the Excel model to determine the optimal aggregate plan for the planning horizon. There is a requirement for no stockouts at the end of June and at least 500 units in inventory. What is the total cost, revenue, and profit for this plan? Create a master production schedule (MPS) for the last month in the aggregate plan. Tables 8-2, 8-3 Aggregate Planning (Chapter 8) Demand Forecast Month Demand Forecast January 1,600 February 3,000 March 3,200 April 3,800 May 2,200 June 2,200 Costs Item Cost Materials cost/unit $ 10 Inventory holding cost/unit/month $ 2 Marginal cost of stockout/unit/month $ 5 Hiring and training cost/worker $ 300 Layoff cost/worker $ 500 Labor hours required/unit 4 Regular time cost/hour $ 4 Over time cost/hour $ 6 Marginal subcontracting cost/unit $ 30 AAA Page 1 Planning Polo Aggregate Plan Decision Variables Ht Lt Wt Ot It St Period # Hired # Laid off # Workforce Overtime Inventory Stockout 0 0 0 80 1,000 1 0 0 80 2,600 2 0 0 80 0 2,800 3 0 0 80 0 2,800 4 0 0 80 0 2,200 5 0 0 80 0 3,200 6 0 0 80 0 4,200 Total Cost = $ 534,800 Base Price Total Revenue = $ 640,000 Profit = $ 105,200 Ct Pt Subcontract Production Demand Price 0 0 0 0 3,200 1,600 40 0 0 3,200 3,000 40 0 0 3,200 3,200 40 0 0 3,200 3,800 40 0 0 3,200 2,200 40 0 0 3,200 2,200 40 $ 40 Page 2 Aggregate Plan 4,500 4,000 3,500 X t 3,000 Inventory 2,500 Production --Demand 2,000 - Stockout *Subcontracting 1,500 1,000 500 0 * 1 * 2 * 3 * 4 5 * 6 Period Assignment 2021-10-05(a) MGT 350 Supply Chain Management Due: 5 OCT 2021 Design a format that you use to submit (via Canvas) your response to the following study questions. It is to be professional in appearance and organized clearly. Provide a concise response (no more than 250 words) to the exercise question below. Include the appropriate spreadsheet results in your response submitted to Canvas. Please refer to the Excel file Ch 08 Red Tomato Tools for the following problem. Be sure to bring hardcopy of your work to class, or your personal device to electronically access it, so you will be able to fully participate in the class discussion. Re.: Chopra, S. (2019) Supply Chain Management: Strategy, Planning, and Operation, 7th Ed. New York, NY: Pearson. Chapter 8 Worksheet Problem Given the data provided in Table 8-2 and Table 8-3 for Red Tomato Tools, use the Excel model to determine the optimal aggregate plan for the planning horizon. There is a requirement for no stockouts at the end of June and at least 500 units in inventory. What is the total cost, revenue, and profit for this plan? Create a master production schedule (MPS) for the last month in the aggregate plan
Step by Step Solution
There are 3 Steps involved in it

Get step-by-step solutions from verified subject matter experts