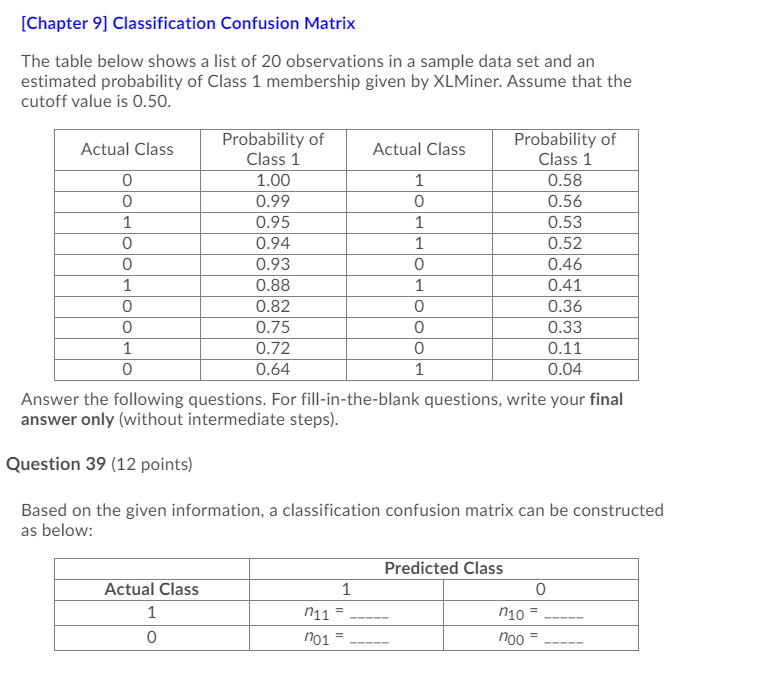
Question: [Chapter 9) Classification Confusion Matrix The table below shows a list of 20 observations in a sample data set and an estimated probability of Class

[Chapter 9) Classification Confusion Matrix The[Chapter 9) Classification Confusion Matrix The[Chapter 9) Classification Confusion Matrix The

[Chapter 9) Classification Confusion Matrix The table below shows a list of 20 observations in a sample data set and an estimated probability of Class 1 membership given by XLMiner. Assume that the cutoff value is 0.50. Actual Class Probability of Probability of Actual Class Class 1 Class 1 0 1.00 1 0.58 0 0.99 0 0.56 1 0.95 1 0.53 0 0.94 1 0.52 0 0.93 0 0.46 1 0.88 1 0.41 0 0.82 0 0.36 0 0.75 0 0.33 1 0.72 0 0.11 0 0.64 1 0.04 Answer the following questions. For fill-in-the-blank questions, write your final answer only (without intermediate steps). Question 39 (12 points) Based on the given information, a classification confusion matrix can be constructed as below: Predicted Class 1 0 Actual Class 1 0 n11 no1 n10 noo In the above classification confusion matrix: n11 = n10 = no1 noo A Round the final answer (if it is not an integer) to the nearest integer. Question 40 (3 points) The Class 1 error rate = A . Use 2- decimal accuracy for the final answer, e.g., 0.12, when necessary. Question 40 (3 points) The Class 1 error rate = A . Use 2- decimal accuracy for the final answer, e.g., 0.12, when necessary. Question 41 (3 points) In general, if we increase the cutoff value, Class 1 error rate may increase or decrease, depending on the sample data will decrease will increase will stay constant Previous Page Next Page Page 27 of 27

Step by Step Solution

There are 3 Steps involved in it

1 Expert Approved Answer
Step: 1 Unlock blur-text-image
Question Has Been Solved by an Expert!

Get step-by-step solutions from verified subject matter experts

Step: 2 Unlock
Step: 3 Unlock

Students Have Also Explored These Related General Management Questions!