

Question: Chapter 9 Problem 16 Suggested Answers Harley-Davidson Inc. 2004 (S millions) Net income $ 889.77 Number of common shares, millions 294.31 Earnings before interest and
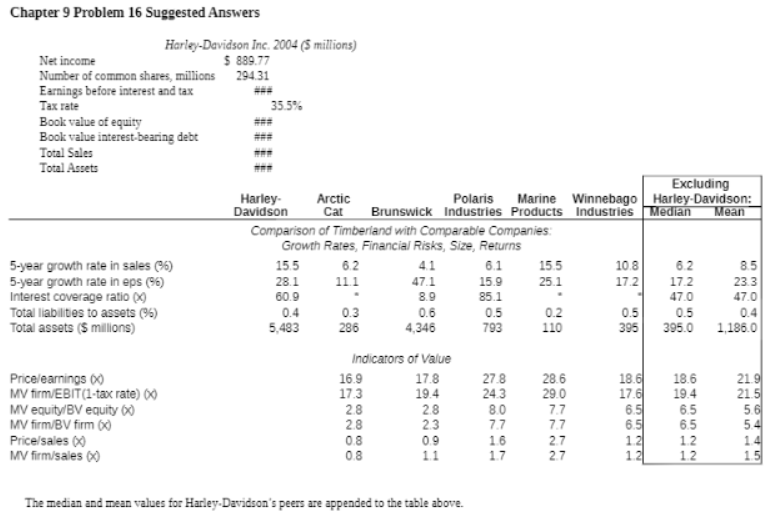
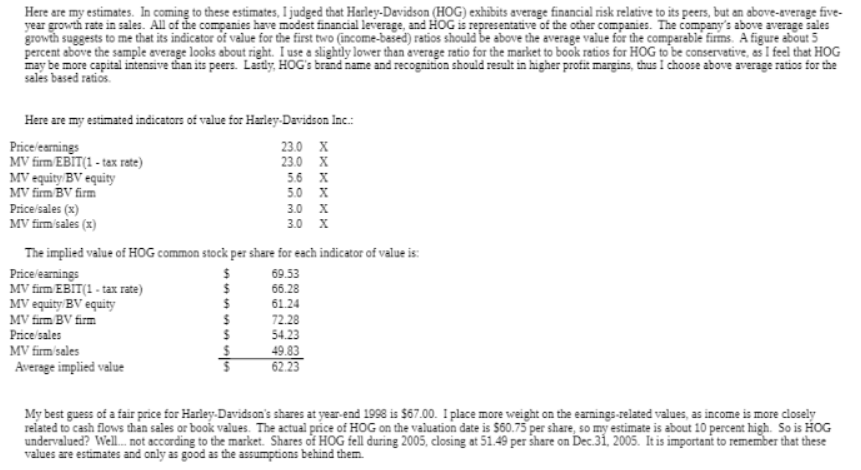
Chapter 9 Problem 16 Suggested Answers Harley-Davidson Inc. 2004 (S millions) Net income $ 889.77 Number of common shares, millions 294.31 Earnings before interest and tax Tax rate 35.5% Book value of equity Book value interest-bearing debt Total Sales Total Asgets Excluding Harley- Arctic Polaris Marine Winnebago Harley-Davidson: Davidson Cat Brunswick Industries Products Industries Median Mean Comparison of Timberland with Comparable Companies Growth Rates, Financial Risks, Size, Returns 5-year growth rate in sales (96) 15.5 6.2 41 6.1 15.5 10.8 6.2 8.5 5-year growth rate in eps (9%) 28.1 11.1 47.1 15.9 25.1 17.2 17.2 23.3 Interest coverage ratio Q) 60.9 8.9 85.1 47.0 47.0 Total liabilities to assets (96) 0.4 0.3 0.6 0.5 0.2 0.5 0.5 0.4 Total assets ($ millions) 5,483 286 4,346 793 110 395 395.0 1,186.0 Indicators of Value Price/earnings 0( 16.9 17.8 27 8 28 6 18.6 18.6 21 9 MV firm/EBIT (1-tax rate) 00 17.3 19.4 24.3 29.0 17.6 19.4 21.5 MV equity BV equity (0 2.8 2.8 8.0 7.7 6.5 6.5 5.6 MV firm/BV firm 60 2.8 2.3 7.7 7.7 6.5 6.5 Price/sales () 0.8 0.9 16 2.7 1 2 12 MV firm/sales () 0.8 1.1 17 2.7 1 21 12 15 The median and mean values for Harley Davidson's peers are appended to the table above.Here are my estimates. In coming to these estimates, I judged that Harley-Davidson (HOG) exhibits average financial risk relative to its peers, but an above-average five- year growth rate in sales. All of the companies have modest financial leverage, and HOG is representative of the other companies. The company's above average sales growth suggests to me that its indicator of value for the first two (income-based) ratios should be above the average value for the comparable firms. A figure about 5 percent above the sample average looks about right. I use a slightly lower than average ratio for the market to book ratios for HOG to be conservative, as I feel that HOG may be more capital intensive than its peers. Lastly, HOG's brand name and recognition should result in higher profit margins, thus I choose above average ratios for the sales based ratios. Here are my estimated indicators of value for Harley Davidson Inc.: Price/earnings 23.0 MV firm EBIT(1 - tax rate) 23.0 MV equity BV equity 5.6 MV firm BV firm 5.0 Y Price/sales (x) 3.0 X MV firm/sales (x) 3.0 X The implied value of HOG common stock per share for each indicator of value is: Price/earnings 69.53 MV firm/EBIT(1 - tax rate) 65.28 MV equity BV equity 61.24 MV firm BV firm 72.28 Price/sales 54.23 MV firm/sales 49.83 Average implied value 62.23 My best guess of a fair price for Harley Davidson's shares at year-end 1998 is $67.00. I place more weight on the earnings-related values, as income is more closely related to cash flows than sales or book values. The actual price of HOG on the valuation date is 560.75 per share, so my estimate is about 10 percent high. So is HOG undervalued? Well... not according to the market. Shares of HOG fell during 2005, closing at 51.49 per share on Dec.31, 2005. It is important to remember that these values are estimates and only as good as the assumptions behind them
Step by Step Solution
There are 3 Steps involved in it

Get step-by-step solutions from verified subject matter experts