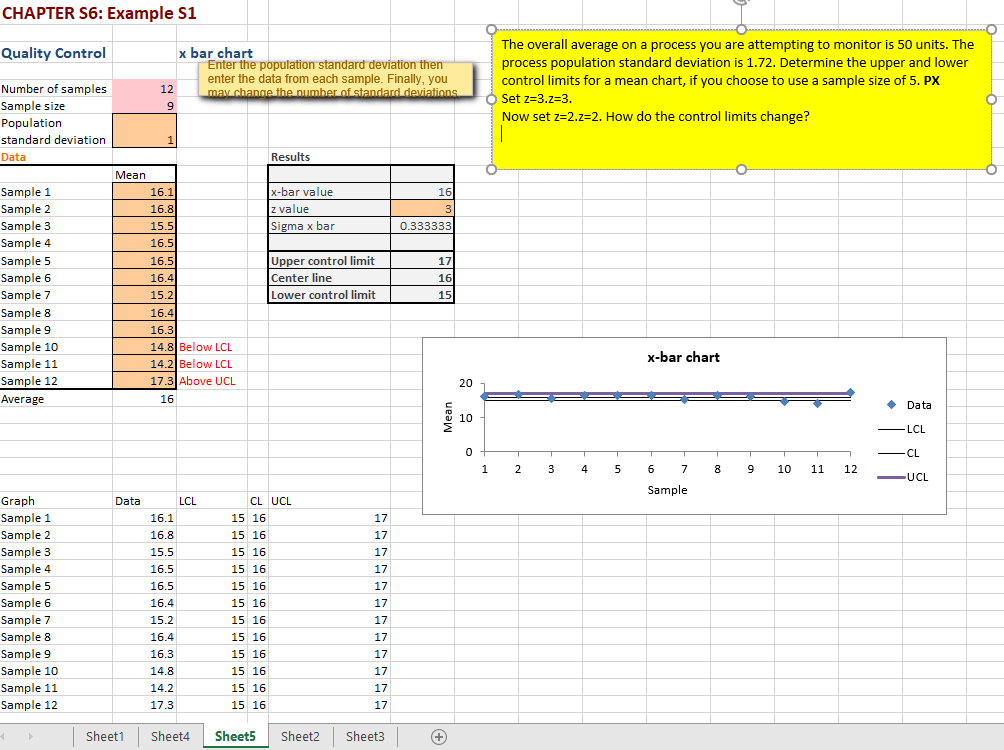
Question: CHAPTER S6: Example S1 Quality Control x bar chart Enter the population standard deviation then enter the data from each sample. Finally, you 12 may

CHAPTER S6: Example S1 Quality Control x bar

CHAPTER S6: Example S1 Quality Control x bar chart Enter the population standard deviation then enter the data from each sample. Finally, you 12 may change the number of standard deviations 9 The overall average on a process you are attempting to monitor is 50 units. The process population standard deviation is 1.72. Determine the upper and lower control limits for a mean chart, if you choose to use a sample size of 5. PX Set z=3.z=3. Now set z=2.z=2. How do the control limits change? Number of samples Sample size Population standard deviation Data 1 Results x-bar value z value Sigma x bar 16 3 0.333333 Sample 1 Sample 2 Sample 3 Sample 4 Sample 5 Sample 6 Sample 7 Sample 8 Sample 9 Sample 10 Sample 11 Sample 12 Average Mean 16.1 16.81 15.5 16.5 16.5 16.4 15.2 16.4 16.3 14.8 Below LCL 14.2 Below LCL 17.3 Above UCL 16 Upper control limit Center line Lower control limit 17 16 15 x-bar chart 20 Data Mean 10 -LCL 0 1 1 1 T CL 1 2 3 4 5 8 9 10 11 12 6 7 Sample UCL Data LCL 17 17 17 17 17 Graph Sample 1 Sample 2 Sample 3 Sample 4 Sample 5 Sample 6 Sample 7 Sample 8 Sample 9 Sample 10 Sample 11 Sample 12 16.1 16.8 15.5 16.5 16.5 16.4 15.2 16.4 16.3 14.8 14.2 17.3 CL UCL 15 16 15 16 15 16 15 16 15 16 15 16 15 16 15 16 15 16 15 16 15 16 15 16 17 17 17 17 17 17 17 Sheet1 Sheet4 Sheet5 Sheet2 Sheet3 +

Step by Step Solution

There are 3 Steps involved in it

1 Expert Approved Answer
Step: 1 Unlock blur-text-image
Question Has Been Solved by an Expert!

Get step-by-step solutions from verified subject matter experts

Step: 2 Unlock
Step: 3 Unlock

Students Have Also Explored These Related General Management Questions!