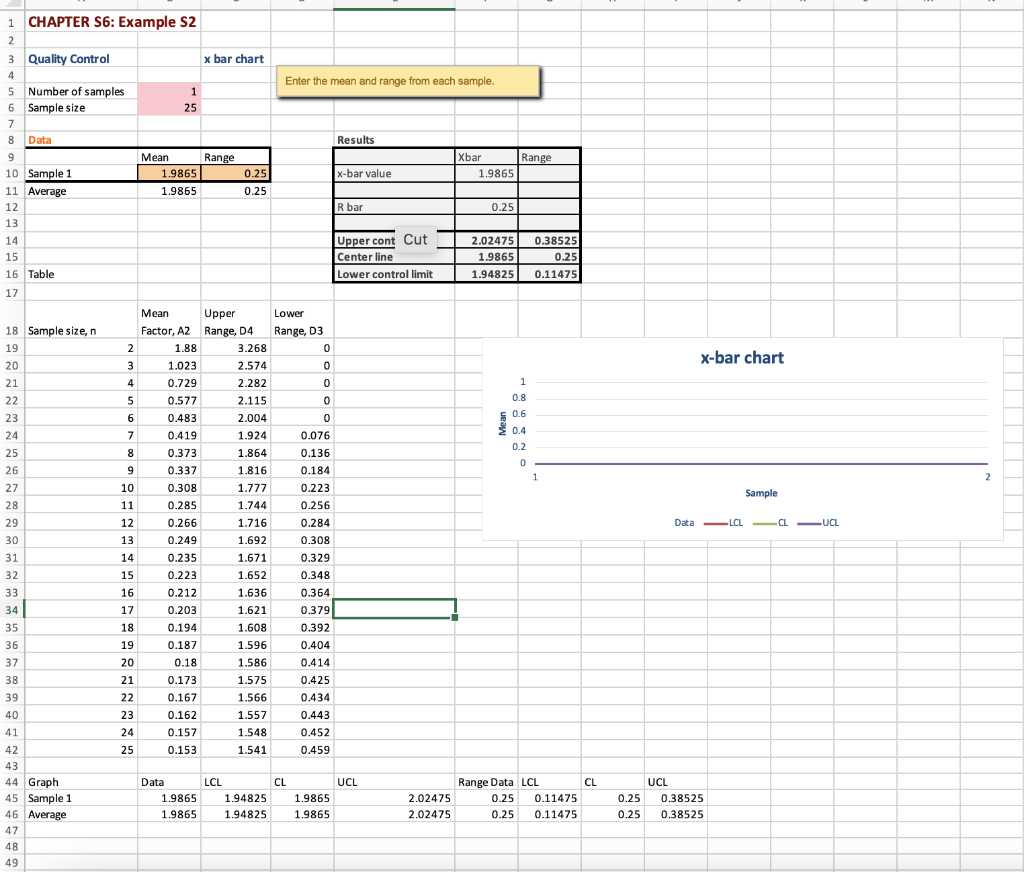
Question: I need an Excel data table also question 1-4 please (Example) x bar chart Enter the mean and range from each sample. 1 CHAPTER S6:

I need an Excel data table also question 1-4I need an Excel data table also question 1-4I need an Excel data table also question 1-4 please (Example)

x bar chart Enter the mean and range from each sample. 1 CHAPTER S6: Example S2 2 3 Quality Control 4 5 Number of samples 1 6 Sample size 25 7 8 Data 9 9 Mean 10 Sample 1 1.9865 1.9865 Results Range Range Xbar 1.9865 X-bar value 11 Average 0.25 0.25 R bar 0.25 12 13 14 15 16 Table 17 Upper cont Cut Center line Lower controllimit 2.02475 1.9865 1.94825 0.38525 0.25 0.11475 Lower Range, D3 0 0 18 Sample size, n 19 20 21 22 2 X-bar chart 3 1 4 5 0 0 0.8 0.6 23 24 6 7 0.2 8 9 9 0 1 2 10 Sample 25 26 27 28 29 30 31 32 11 12 13 0 0.076 0.136 0.184 0.223 0.256 0.284 0.308 0.329 0.348 0.364 0.379 Data LCL cl Mean Upper Factor, A2 Range, D4 1.88 3.268 1.023 2.574 0.729 2.282 0.577 2.115 0.483 2.004 0.419 1.924 0.373 1.864 0.337 1.816 0.308 1.777 0.285 1.744 0.266 1.716 1.692 0.235 1.671 0.223 1.652 0.212 1.636 0.203 1.621 0.194 1.608 0.187 1.596 0.18 1.586 0.173 1.575 0.167 1.566 0.162 1.557 0.157 1.548 0.153 1.541 UCL 0.249 14 15 33 34 35 36 37 16 17 18 19 0.392 0.404 0.414 0.425 20 38 39 21 22 23 24 0.434 0.443 0.452 0.459 25 40 41 42 43 44 Graph 45 Sample 1 46 Average 47 CL UCL CL Data 1.9865 1.9865 LCL 1.94825 1.94825 1.9865 1.9865 2.02475 2.02475 Range Data LCL 0.25 0.11475 0.25 0.11475 0.25 0.25 UCL 0.38525 0.38525 48 49 Part II: Mean weight of silicon chips at Boston Bay Silicon Chip Manufacturing Enter the following data in Excel file name: S6 Example S2 Boston Silicon Chip Manufacturing records data on average chip weight every 25 business days. The Quality Assurance Technician is on vacation. You have been hires to assist in the interpretation of the silicon chip weight distributions. The average weight of a silicon chip is .50 mm or approximately 1.9685 inches. We will use the following data: Mean =1.9865 Range of = 25. All other Excel data should remain unchanged. 1. What is the x (x-bar) value? 2. What is the upper control limit? 3. What is the lower controllimit? 4. What is the R-bar value? What does this reveal about the process variability? 5. Identify the proper conclusion regarding the data? While the process mean the dispersion a. remained constant, has shifted b. has shifted, remained constant

Step by Step Solution

There are 3 Steps involved in it

1 Expert Approved Answer
Step: 1 Unlock blur-text-image
Question Has Been Solved by an Expert!

Get step-by-step solutions from verified subject matter experts

Step: 2 Unlock
Step: 3 Unlock

Students Have Also Explored These Related General Management Questions!