

Question: Chart 3. Logarithmically Transformed Count Rate as a Function of Distance from Source Curve Transformed Count Rate per half minute (N), log(N) 2.40 2.30
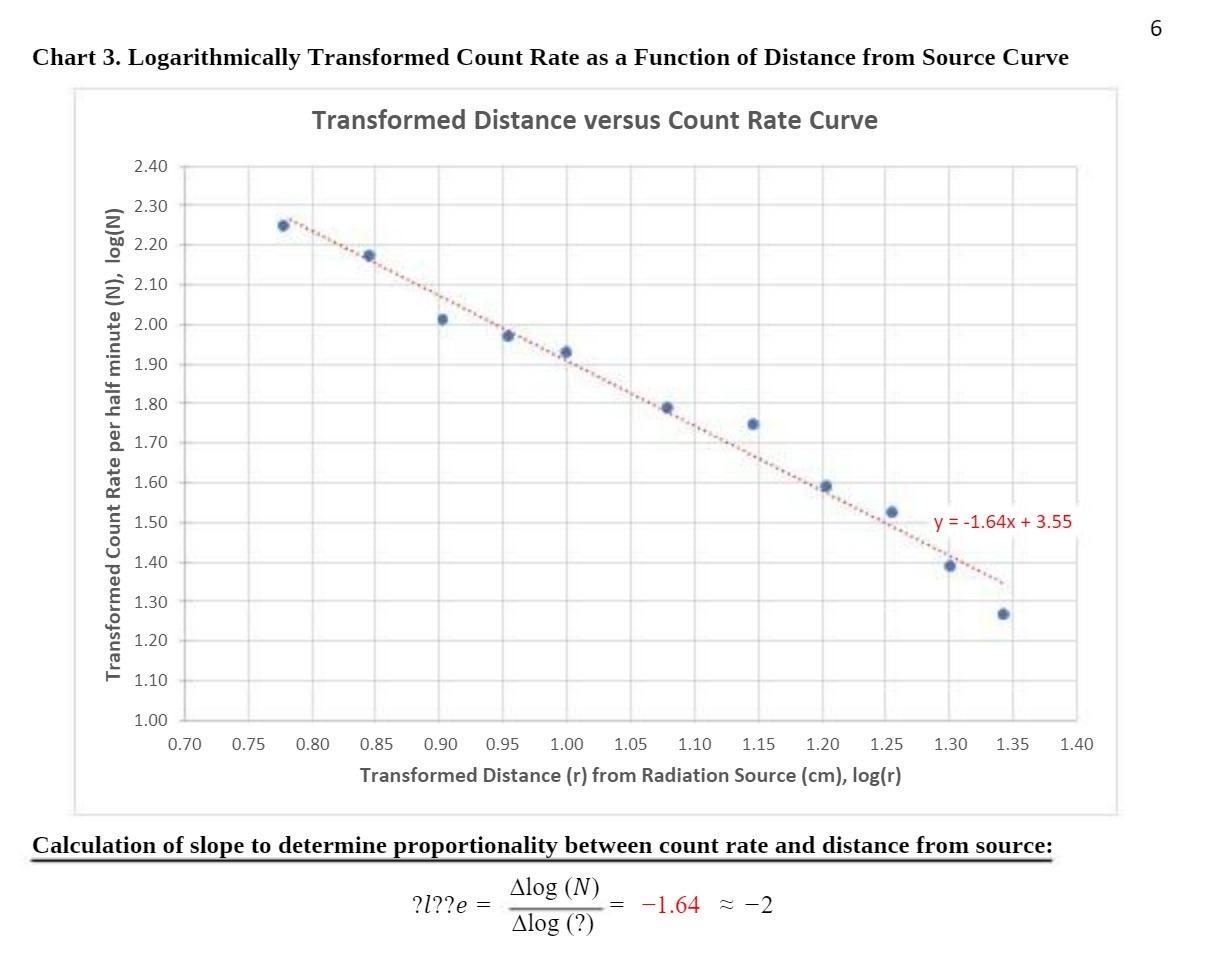
Chart 3. Logarithmically Transformed Count Rate as a Function of Distance from Source Curve Transformed Count Rate per half minute (N), log(N) 2.40 2.30 2.20 2.10 2.00 1.90 1.80 1.70 1.60 1.50 1.40 1.30 1.20 1.10 1.00 0.70 0.75 Transformed Distance versus Count Rate Curve 0.80 0.85 0.90 0.95 1.00 1.05 1.10 1.15 1.20 1.25 1.30 1.35 1.40 Transformed Distance (r) from Radiation Source (cm), log(r) y = -1.64x + 3.55 Calculation of slope to determine proportionality between count rate and distance from source: Alog (N) Alog (?) ?l??e = = -1.64 -2 6
Step by Step Solution
There are 3 Steps involved in it
1 Expert Approved Answer
Step: 1 Unlock

Question Has Been Solved by an Expert!
Get step-by-step solutions from verified subject matter experts
Step: 2 Unlock
Step: 3 Unlock