

Question: Chart A 80 70 - 60 50 40 - 30 20 Flu No FluChart B 90 80 70- 60 - 50 40 30 20 -
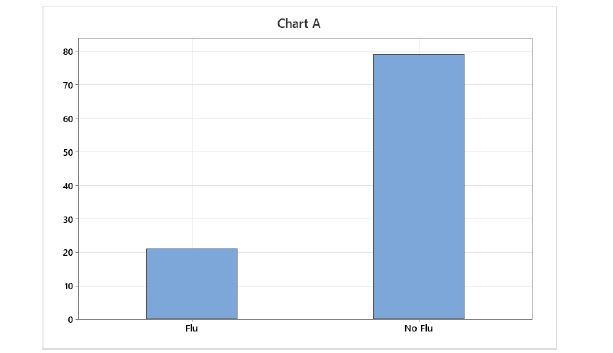
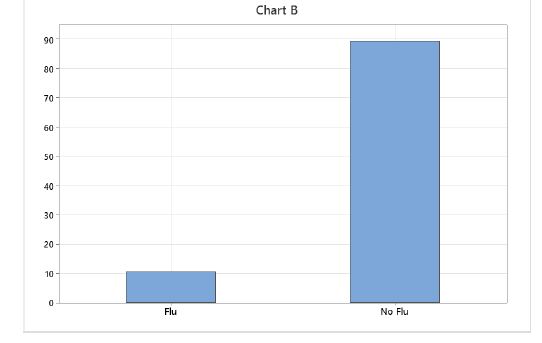
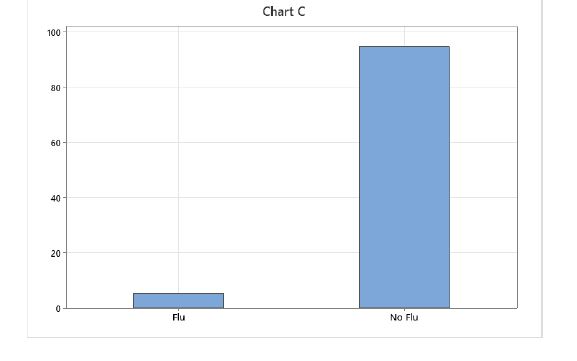
Chart A 80 70 - 60 50 40 - 30 20 Flu No FluChart B 90 80 70- 60 - 50 40 30 20 - 10 - Flu No FluChart C 100 80 60 - 40 - 20 - 0 Flu No Flu
Step by Step Solution
There are 3 Steps involved in it
1 Expert Approved Answer
Step: 1 Unlock

Question Has Been Solved by an Expert!
Get step-by-step solutions from verified subject matter experts
Step: 2 Unlock
Step: 3 Unlock