Question: hey i need help woth the capstone app, making descions Recalculate Name Price Promo Budget 5 1400 Sales Budget $ M Marketing Benchmark Your Prediction
hey i need help woth the capstone app, making descions
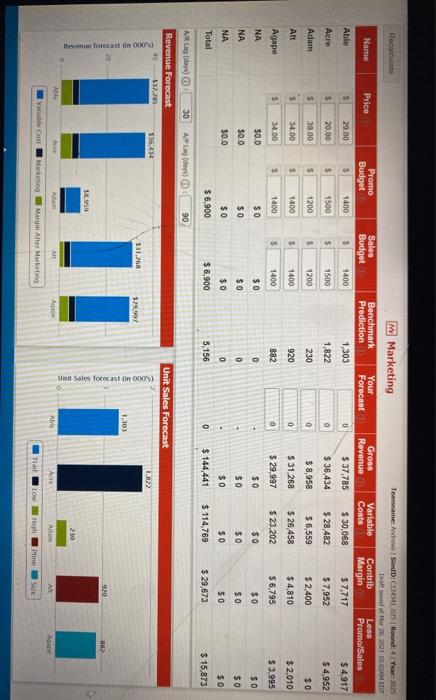
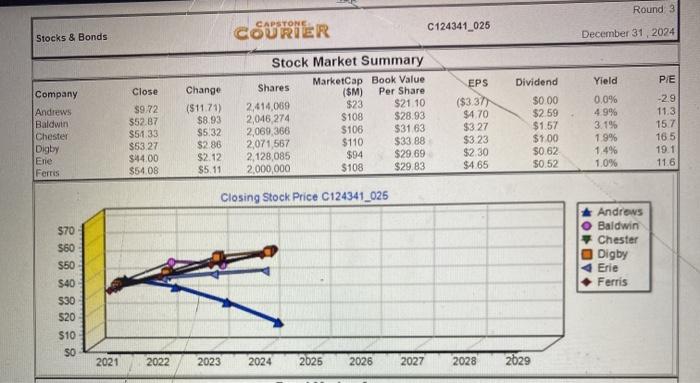
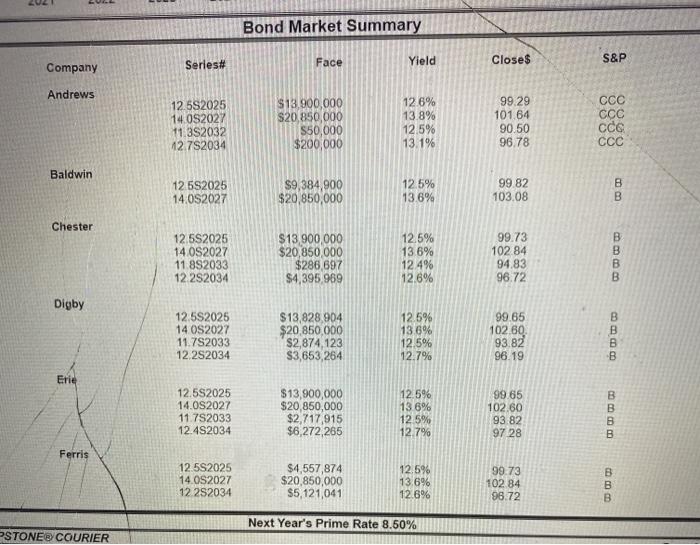
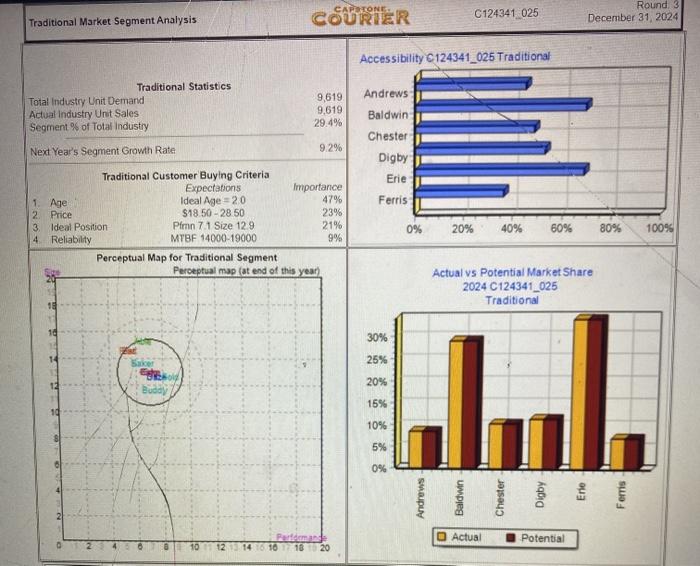
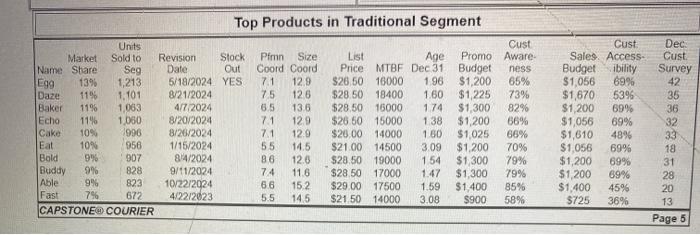
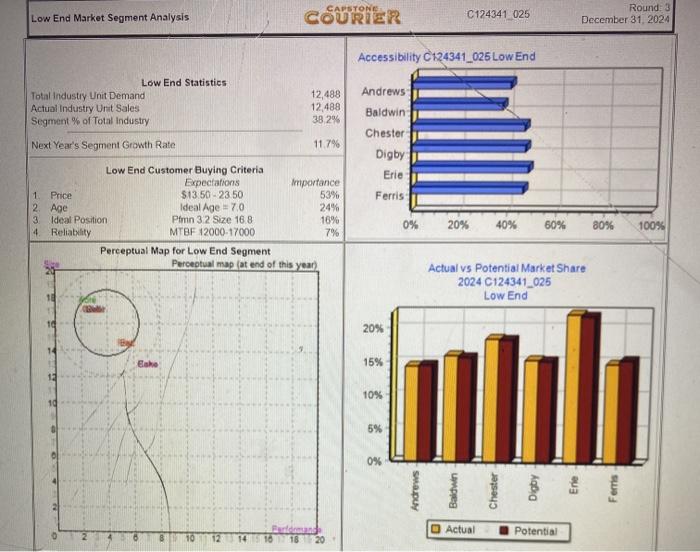
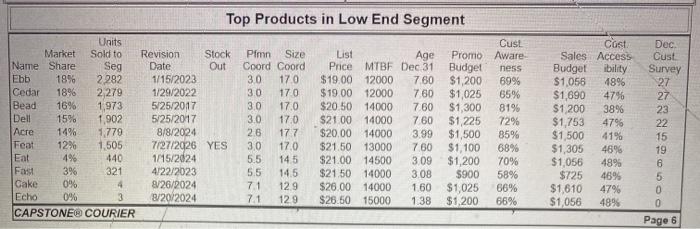
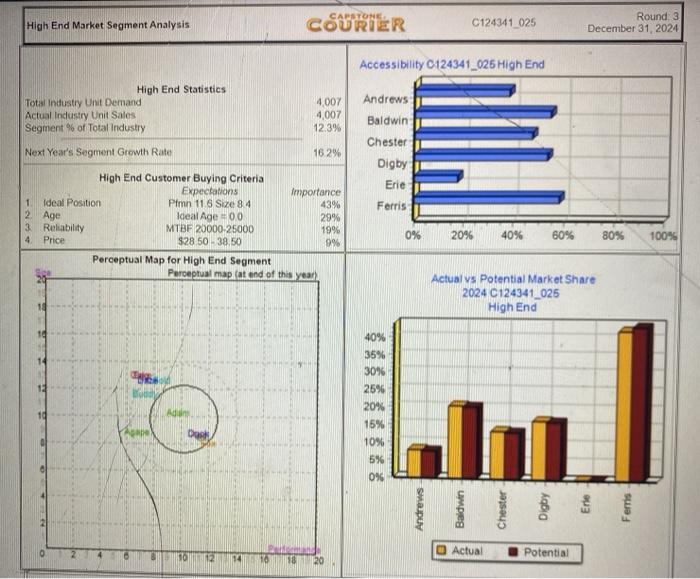
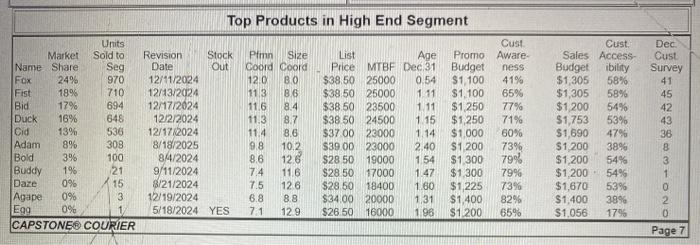
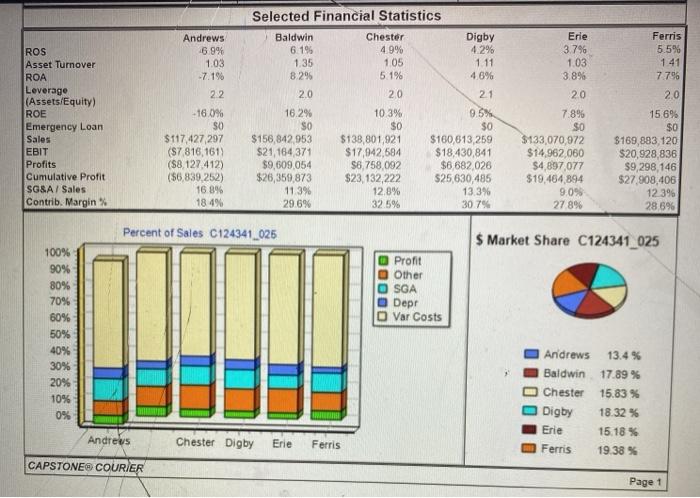
Recalculate Name Price Promo Budget 5 1400 Sales Budget $ M Marketing Benchmark Your Prediction Forecast 1,303 1,822 Team tamet die SCIMMI Round: Year: 2005 Duft ved at w 2001.GAMED Gross Variable Contrib Less Revenue Costs Margin Promo/Sales $ 37,785 $ 30,068 $7,717 $ 4,917 Able 5 29.00 1400 0 Acre 5 20.00 $ 1500 5 1500 $36,434 $ 4,952 $0 Adam $ 39.00 $ 1200 $ 1200 230 0 $ 8,958 $7.952 $ 2,400 $4,810 Alt 5 34.00 $ 1400 $ 1400 920 0 $ 28,482 $ 6,559 $ 26,458 $ 23,202 $0 $ 31,268 $ 2,010 Agape 5 34.00 $ 1400 $ 1400 882 0 $ 29,997 $0 $ 6,795 $0 $0.0 50 $0 NA NA $0.0 $0 $0 0 $0 $0 $0 $ 3,995 $0 $0 $0 $ 15,873 NA 50,0 $0 so 0 $0 $0 Total SO $ 144,441 $6,900 $ 6,900 5.156 0 $ 114,769 $ 29,673 90 A Lada 30 A/P days) Revenue Forecast Unit Sales Forecast 10 136,434 1822 531,268 529.997 1,303 Revenue forecastin O'N II.IL Unit Sales forecastin) 920 882 18.959 2:30 A AR Age A Vare cost Marketing Margin Alter Marketing Trac Low that Size Andrews 6.9% 1.03 -7.1% 22 Erie 3.796 1.03 3.8% 20 Ferris 5.5% 1.41 7.796 2.0 ROS Asset Turnover ROA Leverago (Assets/Equity) ROE Emergency Loan Sales EBIT Profits Cumulative Profit SGSA/ Sales Contrib. Margin% -16.0% SO $117,427 297 (S7 816,161 ($8.127.412) (56,839.252) 16.8% 184% Selected Financial Statistics Baldwin Chester Digby 6.199 4.9% 4.2% 1.35 105 1.11 8.2% 5 1% 4.6% 2.0 20 21 16.2% 10.3% 9.5% SO SO $0 $156,842 953 $138,801,921 $160,613,259 $21,164 371 $17,942,684 $18,430,841 $9,609.054 56,758.092 $6 682026 $26,359,873 $23,132,222 $25,630,485 11.3% 12.8% 13.3% 29.6% 32.5% 307% 7.896 SO $133,070,972 $14.962 060 $4,897,077 $19,464,894 90% 27 89 15 695 $0 $169,883,120 $20,928,836 $9,298,146 $27.908,406 12 396 28 6% Percent of Sales C124341_025 $ Market Share C124341_025 Pront 0 Other O SGA Depr O Var Costs 100% 90% 80% 70% 60% 50% 40% 30% 20% 10% 0% Andrews 13.4 % Baldwin 17.89% O Chester 15.83 % Digby 18.32% Erie 15.18% Ferris 19.38 % Andres Chester Digby Erie Ferris CAPSTONE COURIER Page 1 Round 3 CAPSTONE COURIER C124341_025 Stocks & Bonds December 31, 2024 Dividend Yield PE Close Change ($1170) $8.93 $5.32 -2.9 11.3 Company Andrews Baldwin Chester Digby Ene Ferris Stock Market Summary Shares MarketCap Book Value ($M) Per Share 2,414,069 $23 $21.10 2,046 274 $108 $28.93 2,069,366 $106 $3163 2,071,567 $110 $33 88 2,128,085 $94 $29.69 2,000,000 $108 $29.83 $9.72 $52.87 $54.33 $53 27 $44.00 $54 08 15.7 EPS ($337) $4.70 $327 $3 23 $2.30 $4.65 $0.00 $259 $1.57 $1.00 $0.62 $0.52 0.0% 49% 3.19 1.9% 1.4% 1.0% $2 86 165 19.1 11.6 $2.12 $5.11 Closing Stock Price C124341_025 $70 $60 $50 $40 $30 520 Andrews O Baldwin Chester Digby 4 Erie Ferris $10 SO 2021 2022 2023 2024 2626 2026 2027 2028 2629 Bond Market Summary Face Series# Yield Closes S&P Company Andrews 12.5S2025 14 082027 11.32032 12 7S2034 $13.900,000 $20 850,000 550,000 $200,000 12 6% 13.8% 12.5% 13.1% 99.29 101.64 90.50 96.78 CCC CCC CCG Baldwin 12 552025 14.092027 $9,384,900 $20,850,000 125% 13.6% 99.82 103.08 8 B Chester B 12 552025 14.0S2027 11.892033 12252034 $13.900,000 $20,850,000 $286.697 $4,395 969 12.5% 13.6% 124% 12.6% 99.73 102 84 94.83 96.72 Digby B 12.592025 14 082027 11.752033 12.252034 $13,828 904 $20 850 000 $2,874,123 $3,653,264 12.5% 13.6% 12.5% 12.7% 99.65 102.60 93.82 96.19 D B Erie 12.5S2025 14.0S2027 11.752033 12.482034 $13,900,000 $20 850,000 $2,717,915 $6,272,265 12.5% 13 6% 125% 12.7% 99 65 102.60 93.82 97 28 B B B B Ferris 12.5S2025 14.0S2027 12 252034 $4,557,874 $20,850,000 $5,121,041 12.5% 13.6% 12.6% 99 73 102 84 96.72 B B B Next Year's Prime Rate 8.50% -STONE COURIER CAPOTONE COURIER C124341 025 Round 3 December 31, 2024 Traditional Market Segment Analysis Accessibility C124341_025 Traditional Andrews Traditional Statistics Total Industry Unit Demand Actual Industry Unit Sales Segment % of Total Industry 9,619 9,619 29.4% Baldwin Chester 9.2% Next Year's Segment Growth Rate Digby Erie Ferris Traditional Customer Buying Criteria Expectations Importance 1. Age Ideal Age = 20 47% 2 Price $18.50 - 2850 23% 3 Ideal Position Pimn 7 1 Size 129 21% 4 Reliability MTBF 14000-19000 9% Perceptual Map for Traditional Segment Perceptual map fat end of this year 0% 20% 40% 60% 80% 100% Actual vs Potential Market Share 2024 C124341_025 Traditional 30% 25% 20% 15% 10% 5% 0% O Actual Potential 10 12 14 6 10 20 1196 Top Products in Traditional Segment Units Cust Market Sold to Revision Stock Pfmn Size List Age Promo Aware Name Share Seg Date Out Coord Coord Price MTBF Dec 31 Budget ness Egg 1395 1,213 5/18/2024 YES 71 12.9 $26.50 16000 1.96 $1,200 65% Daze 119 1.101 8/21/2024 75 126 $28.50 18400 1.60 $1,225 73% Baker 1063 477 2024 65 13.6 $28.50 16000 1.74 $1,300 82% Echa 1196 1.050 8/20/2024 71 129 $26.50 15000 138 $1,200 66% Cake 10% 1996 8/20/2024 71 129 $2300 14000 1.50 $1,025 66% Eat 10N 956 1/15/2024 55 14,5 $21.00 14500 3.09 $1,200 70% Bold 9% 907 874/2024 86 12.6 $28.50 19000 154 $1,300 79% Buddy 9% 828 9/11/2024 74 116 $28.50 17000 1.47 $1,300 79% Able 9% 823 10/22/2024 66 15.2 $29.00 17500 1.59 85% Fast 7% $1,400 672 4/22/2023 5.5 14.5 $21.50 14000 3.08 $900 58% CAPSTONE COURIER Cust Dec Sales Access Cust Budget ibility Survey $1,056 69% 42 $1,670 5396 35 $1,200 69% 36 $1,056 69% 32 $1,610 4896 33 $1,056 69% 18 $1,200 699 31 $1,200 69% 28 $1,400 45% 20 $725 36% 13 Page 5 CAPSTONE Low End Market Segment Analysis C124341 025 Round: 3 December 31, 2024 Accessibility C124341_026 Low End Andrews Low End Statistics Total Industry Unit Demand Actual Industry Unit Sales Segment % of Total Industry 12,488 12,488 38.2% Baldwin Chester Next Year's Segment Growth Rate 11.7% Digby Erie Ferris Low End Customer Buying Criteria Expectations importance 1. Price $13.50 -23 50 53% 2. Age Ideal Age-70 24% 3 Ideal Position Pimn 32 Size 16.8 16% 4. Reliability MTBF 12000-17000 7% Perceptual Map for Low End Segment Perceptual map at end of this year 0% 20% 40% 60% 80% 100% Actual vs Potential Market Share 2024 C124341_025 Low End 20% Bake 15% ulili 10% 5% 0% Andrews Ferris Actual Potential 48% Top Products in Low End Segment Units Cust Market Sold to Revision Stock Pimn Size List Age Promo Aware Name Share Seg Date Out Coord Coord Price MTBF Dec 31 Budget ness Ebb 19% 2.282 1/15/2023 30 17.0 $19.00 12000 7.60 $1,200 69% Cedar 18% 2,279 1/29/2022 170 $19.00 12000 760 $1,025 65% Bead 16% 1,973 5/25/2017 3.0 17.0 $20.50 14000 7.60 $1,300 819 Dell 15% 1,902 5/25/2017 3.0 17.0 $2100 14000 760 $1,225 72% Acre 14% 1779 8/8/2024 26 177 $20.00 14000 3.99 $1,500 85% Feat 12% 1,505 7/27/2026 YES 30 17.0 $21.50 13000 7 60 $1,100 68% Eat 4% 440 1/15/2024 5.5 145 $21.00 14500 3.09 $1,200 70% Fast 3% 321 4/22/2023 5.5 14.5 $21.50 14000 3.08 $900 58% Cake 0% 8/26/2024 7.1 129 $26.00 14000 1.60 $1,025 66% Echo 0% 3 8/20/2024 7.1 129 $26.50 15000 1.38 $1,200 66% CAPSTONEO COURIER Cost Dec Sales Access Cust Budget ibility Survey $1,056 27 $1,690 4796 27 $1200 38% 23 $1,753 47% 22 $1,500 41% 15 $1,305 46% 19 $1,056 48% 6 $725 46% 5 $1,610 47% 0 $1,056 489 0 Page 6 CAPSTONE High End Market Segment Analysis C124341_025 Round 3 December 31, 2024 Accessibility C124341_026 High End High End Statistics Total Industry Unit Demand Actual Industry Unit Sales Segment % of Total Industry 4,007 4,007 12.3% Andrews Baldwin = Chester Next Year's Segment Growth Rate 16.2% Digby Erie Ferris High End Customer Buying Criteria Expectations Importance 1 Ideal Position Pimn 11.8 Size 84 43% 2. Age Ideal Age=00 29% 3 Reliability MTBF 20000-25000 19% 4 Price $28 50 38.50 9% Perceptual Map for High End Segment Perceptual map Cat and of this year 0% 20% 40% 60% 80% 100% Actual vs Potential Market Share 2024 C124341_025 High End 40% 35% 30% 25% 20% 15% 10% 5% 0% Andrews Baldwin Actual Potential 10 12 1410 Dec 2496 Units Market Sold to Name Share Seg Fox 970 Fist 189 710 Bid 17% 694 Duck 16% 648 Cid 13% 536 Adam 303 Bold 3% 100 Buddy 19 21 Daze 0% X 15 Agape 0% 3 Egg 0% CAPSTONE COURIER Top Products in High End Segment Cust Revision Stock Pimn Size List Age Promo Aware Date Out Coord Coord Price MTBF Dec 31 Budget ness 12/11/2024 120 $38.50 25000 0.54 $1,100 41% 12/13/2024 113 86 $3850 25000 1 11 $1,100 65% 12/7/2024 116 8.4 $3850 23500 1.11 $1250 77% 12/2/2024 11.3 8.7 $38 50 24500 1 15 $1,250 71% 12/17/2024 11.4 8.6 $37 00 23000 1.14 $1,000 60% 8/18/2025 9.8 10.2 $39.00 23000 2.40 $1,200 73% 84/2024 8,6 126 $28.50 19000 154 $1 300 799 9/11/2024 74 116 $28 50 17000 1.47 $1,300 7996 8/21/2024 126 $28.50 18400 1.60 $1225 73% 12/19/2024 6.8 8.8 $34.00 20000 1,31 $1,400 82% 5/18/2024 YES 71 12.9 $26.50 16000 1.96 $1200 65% Cust Sales Access Budget ibility $1,305 58% $1,305 58% $1200 54% $1,753 53% $1,690 47% $1.200 38% $1,200 54% $1200 549 $1,670 53% $1,400 38% $1,056 1796 Cust Survey 41 45 42 43 36 8 8% 1 0 0 Page 7 Recalculate Name Price Promo Budget 5 1400 Sales Budget $ M Marketing Benchmark Your Prediction Forecast 1,303 1,822 Team tamet die SCIMMI Round: Year: 2005 Duft ved at w 2001.GAMED Gross Variable Contrib Less Revenue Costs Margin Promo/Sales $ 37,785 $ 30,068 $7,717 $ 4,917 Able 5 29.00 1400 0 Acre 5 20.00 $ 1500 5 1500 $36,434 $ 4,952 $0 Adam $ 39.00 $ 1200 $ 1200 230 0 $ 8,958 $7.952 $ 2,400 $4,810 Alt 5 34.00 $ 1400 $ 1400 920 0 $ 28,482 $ 6,559 $ 26,458 $ 23,202 $0 $ 31,268 $ 2,010 Agape 5 34.00 $ 1400 $ 1400 882 0 $ 29,997 $0 $ 6,795 $0 $0.0 50 $0 NA NA $0.0 $0 $0 0 $0 $0 $0 $ 3,995 $0 $0 $0 $ 15,873 NA 50,0 $0 so 0 $0 $0 Total SO $ 144,441 $6,900 $ 6,900 5.156 0 $ 114,769 $ 29,673 90 A Lada 30 A/P days) Revenue Forecast Unit Sales Forecast 10 136,434 1822 531,268 529.997 1,303 Revenue forecastin O'N II.IL Unit Sales forecastin) 920 882 18.959 2:30 A AR Age A Vare cost Marketing Margin Alter Marketing Trac Low that Size Andrews 6.9% 1.03 -7.1% 22 Erie 3.796 1.03 3.8% 20 Ferris 5.5% 1.41 7.796 2.0 ROS Asset Turnover ROA Leverago (Assets/Equity) ROE Emergency Loan Sales EBIT Profits Cumulative Profit SGSA/ Sales Contrib. Margin% -16.0% SO $117,427 297 (S7 816,161 ($8.127.412) (56,839.252) 16.8% 184% Selected Financial Statistics Baldwin Chester Digby 6.199 4.9% 4.2% 1.35 105 1.11 8.2% 5 1% 4.6% 2.0 20 21 16.2% 10.3% 9.5% SO SO $0 $156,842 953 $138,801,921 $160,613,259 $21,164 371 $17,942,684 $18,430,841 $9,609.054 56,758.092 $6 682026 $26,359,873 $23,132,222 $25,630,485 11.3% 12.8% 13.3% 29.6% 32.5% 307% 7.896 SO $133,070,972 $14.962 060 $4,897,077 $19,464,894 90% 27 89 15 695 $0 $169,883,120 $20,928,836 $9,298,146 $27.908,406 12 396 28 6% Percent of Sales C124341_025 $ Market Share C124341_025 Pront 0 Other O SGA Depr O Var Costs 100% 90% 80% 70% 60% 50% 40% 30% 20% 10% 0% Andrews 13.4 % Baldwin 17.89% O Chester 15.83 % Digby 18.32% Erie 15.18% Ferris 19.38 % Andres Chester Digby Erie Ferris CAPSTONE COURIER Page 1 Round 3 CAPSTONE COURIER C124341_025 Stocks & Bonds December 31, 2024 Dividend Yield PE Close Change ($1170) $8.93 $5.32 -2.9 11.3 Company Andrews Baldwin Chester Digby Ene Ferris Stock Market Summary Shares MarketCap Book Value ($M) Per Share 2,414,069 $23 $21.10 2,046 274 $108 $28.93 2,069,366 $106 $3163 2,071,567 $110 $33 88 2,128,085 $94 $29.69 2,000,000 $108 $29.83 $9.72 $52.87 $54.33 $53 27 $44.00 $54 08 15.7 EPS ($337) $4.70 $327 $3 23 $2.30 $4.65 $0.00 $259 $1.57 $1.00 $0.62 $0.52 0.0% 49% 3.19 1.9% 1.4% 1.0% $2 86 165 19.1 11.6 $2.12 $5.11 Closing Stock Price C124341_025 $70 $60 $50 $40 $30 520 Andrews O Baldwin Chester Digby 4 Erie Ferris $10 SO 2021 2022 2023 2024 2626 2026 2027 2028 2629 Bond Market Summary Face Series# Yield Closes S&P Company Andrews 12.5S2025 14 082027 11.32032 12 7S2034 $13.900,000 $20 850,000 550,000 $200,000 12 6% 13.8% 12.5% 13.1% 99.29 101.64 90.50 96.78 CCC CCC CCG Baldwin 12 552025 14.092027 $9,384,900 $20,850,000 125% 13.6% 99.82 103.08 8 B Chester B 12 552025 14.0S2027 11.892033 12252034 $13.900,000 $20,850,000 $286.697 $4,395 969 12.5% 13.6% 124% 12.6% 99.73 102 84 94.83 96.72 Digby B 12.592025 14 082027 11.752033 12.252034 $13,828 904 $20 850 000 $2,874,123 $3,653,264 12.5% 13.6% 12.5% 12.7% 99.65 102.60 93.82 96.19 D B Erie 12.5S2025 14.0S2027 11.752033 12.482034 $13,900,000 $20 850,000 $2,717,915 $6,272,265 12.5% 13 6% 125% 12.7% 99 65 102.60 93.82 97 28 B B B B Ferris 12.5S2025 14.0S2027 12 252034 $4,557,874 $20,850,000 $5,121,041 12.5% 13.6% 12.6% 99 73 102 84 96.72 B B B Next Year's Prime Rate 8.50% -STONE COURIER CAPOTONE COURIER C124341 025 Round 3 December 31, 2024 Traditional Market Segment Analysis Accessibility C124341_025 Traditional Andrews Traditional Statistics Total Industry Unit Demand Actual Industry Unit Sales Segment % of Total Industry 9,619 9,619 29.4% Baldwin Chester 9.2% Next Year's Segment Growth Rate Digby Erie Ferris Traditional Customer Buying Criteria Expectations Importance 1. Age Ideal Age = 20 47% 2 Price $18.50 - 2850 23% 3 Ideal Position Pimn 7 1 Size 129 21% 4 Reliability MTBF 14000-19000 9% Perceptual Map for Traditional Segment Perceptual map fat end of this year 0% 20% 40% 60% 80% 100% Actual vs Potential Market Share 2024 C124341_025 Traditional 30% 25% 20% 15% 10% 5% 0% O Actual Potential 10 12 14 6 10 20 1196 Top Products in Traditional Segment Units Cust Market Sold to Revision Stock Pfmn Size List Age Promo Aware Name Share Seg Date Out Coord Coord Price MTBF Dec 31 Budget ness Egg 1395 1,213 5/18/2024 YES 71 12.9 $26.50 16000 1.96 $1,200 65% Daze 119 1.101 8/21/2024 75 126 $28.50 18400 1.60 $1,225 73% Baker 1063 477 2024 65 13.6 $28.50 16000 1.74 $1,300 82% Echa 1196 1.050 8/20/2024 71 129 $26.50 15000 138 $1,200 66% Cake 10% 1996 8/20/2024 71 129 $2300 14000 1.50 $1,025 66% Eat 10N 956 1/15/2024 55 14,5 $21.00 14500 3.09 $1,200 70% Bold 9% 907 874/2024 86 12.6 $28.50 19000 154 $1,300 79% Buddy 9% 828 9/11/2024 74 116 $28.50 17000 1.47 $1,300 79% Able 9% 823 10/22/2024 66 15.2 $29.00 17500 1.59 85% Fast 7% $1,400 672 4/22/2023 5.5 14.5 $21.50 14000 3.08 $900 58% CAPSTONE COURIER Cust Dec Sales Access Cust Budget ibility Survey $1,056 69% 42 $1,670 5396 35 $1,200 69% 36 $1,056 69% 32 $1,610 4896 33 $1,056 69% 18 $1,200 699 31 $1,200 69% 28 $1,400 45% 20 $725 36% 13 Page 5 CAPSTONE Low End Market Segment Analysis C124341 025 Round: 3 December 31, 2024 Accessibility C124341_026 Low End Andrews Low End Statistics Total Industry Unit Demand Actual Industry Unit Sales Segment % of Total Industry 12,488 12,488 38.2% Baldwin Chester Next Year's Segment Growth Rate 11.7% Digby Erie Ferris Low End Customer Buying Criteria Expectations importance 1. Price $13.50 -23 50 53% 2. Age Ideal Age-70 24% 3 Ideal Position Pimn 32 Size 16.8 16% 4. Reliability MTBF 12000-17000 7% Perceptual Map for Low End Segment Perceptual map at end of this year 0% 20% 40% 60% 80% 100% Actual vs Potential Market Share 2024 C124341_025 Low End 20% Bake 15% ulili 10% 5% 0% Andrews Ferris Actual Potential 48% Top Products in Low End Segment Units Cust Market Sold to Revision Stock Pimn Size List Age Promo Aware Name Share Seg Date Out Coord Coord Price MTBF Dec 31 Budget ness Ebb 19% 2.282 1/15/2023 30 17.0 $19.00 12000 7.60 $1,200 69% Cedar 18% 2,279 1/29/2022 170 $19.00 12000 760 $1,025 65% Bead 16% 1,973 5/25/2017 3.0 17.0 $20.50 14000 7.60 $1,300 819 Dell 15% 1,902 5/25/2017 3.0 17.0 $2100 14000 760 $1,225 72% Acre 14% 1779 8/8/2024 26 177 $20.00 14000 3.99 $1,500 85% Feat 12% 1,505 7/27/2026 YES 30 17.0 $21.50 13000 7 60 $1,100 68% Eat 4% 440 1/15/2024 5.5 145 $21.00 14500 3.09 $1,200 70% Fast 3% 321 4/22/2023 5.5 14.5 $21.50 14000 3.08 $900 58% Cake 0% 8/26/2024 7.1 129 $26.00 14000 1.60 $1,025 66% Echo 0% 3 8/20/2024 7.1 129 $26.50 15000 1.38 $1,200 66% CAPSTONEO COURIER Cost Dec Sales Access Cust Budget ibility Survey $1,056 27 $1,690 4796 27 $1200 38% 23 $1,753 47% 22 $1,500 41% 15 $1,305 46% 19 $1,056 48% 6 $725 46% 5 $1,610 47% 0 $1,056 489 0 Page 6 CAPSTONE High End Market Segment Analysis C124341_025 Round 3 December 31, 2024 Accessibility C124341_026 High End High End Statistics Total Industry Unit Demand Actual Industry Unit Sales Segment % of Total Industry 4,007 4,007 12.3% Andrews Baldwin = Chester Next Year's Segment Growth Rate 16.2% Digby Erie Ferris High End Customer Buying Criteria Expectations Importance 1 Ideal Position Pimn 11.8 Size 84 43% 2. Age Ideal Age=00 29% 3 Reliability MTBF 20000-25000 19% 4 Price $28 50 38.50 9% Perceptual Map for High End Segment Perceptual map Cat and of this year 0% 20% 40% 60% 80% 100% Actual vs Potential Market Share 2024 C124341_025 High End 40% 35% 30% 25% 20% 15% 10% 5% 0% Andrews Baldwin Actual Potential 10 12 1410 Dec 2496 Units Market Sold to Name Share Seg Fox 970 Fist 189 710 Bid 17% 694 Duck 16% 648 Cid 13% 536 Adam 303 Bold 3% 100 Buddy 19 21 Daze 0% X 15 Agape 0% 3 Egg 0% CAPSTONE COURIER Top Products in High End Segment Cust Revision Stock Pimn Size List Age Promo Aware Date Out Coord Coord Price MTBF Dec 31 Budget ness 12/11/2024 120 $38.50 25000 0.54 $1,100 41% 12/13/2024 113 86 $3850 25000 1 11 $1,100 65% 12/7/2024 116 8.4 $3850 23500 1.11 $1250 77% 12/2/2024 11.3 8.7 $38 50 24500 1 15 $1,250 71% 12/17/2024 11.4 8.6 $37 00 23000 1.14 $1,000 60% 8/18/2025 9.8 10.2 $39.00 23000 2.40 $1,200 73% 84/2024 8,6 126 $28.50 19000 154 $1 300 799 9/11/2024 74 116 $28 50 17000 1.47 $1,300 7996 8/21/2024 126 $28.50 18400 1.60 $1225 73% 12/19/2024 6.8 8.8 $34.00 20000 1,31 $1,400 82% 5/18/2024 YES 71 12.9 $26.50 16000 1.96 $1200 65% Cust Sales Access Budget ibility $1,305 58% $1,305 58% $1200 54% $1,753 53% $1,690 47% $1.200 38% $1,200 54% $1200 549 $1,670 53% $1,400 38% $1,056 1796 Cust Survey 41 45 42 43 36 8 8% 1 0 0 Page 7