

Question: Check different sheets on this workbook. In the Dashboard and Reasoning sheet, create a dashboard that shows a summary of the companys financial statement. Compare
 Check different sheets on this workbook. In the Dashboard and Reasoning sheet, create a dashboard that shows a summary of the companys financial statement. Compare the data provided on Retained Earning, Intangible and Goodwill and Income Statement sheets between the years of 2011 to 2020 and explain the best and the worst years for the company. Use at least one chart (choose the best chart type) to help you with the illustration. Write two paragraphs about the best and the worst years and explain your reasons as a business data analyst. Your two paragraphs together should not be less than 200 words.
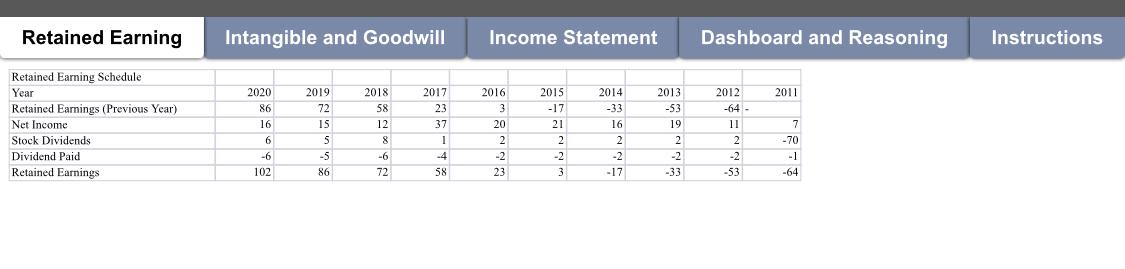
Retained Earning Intangible and Goodwill Income Statement Dashboard and Reasoning Instructions 2012 2011 Retained Earning Schedule Year Retained Earnings (Previous Year) Net Income Stock Dividends Dividend Paid Retained Earnings 2020 86 16 -64 - 2019 72 IS 5 -5 86 2018 58 12 8 -6 2017 23 37 1 2016 3 20 2 2015 -17 21 2 2014 -33 16 2 -2 2013 -53 19 2 7 -70 6 -6 102 -4 58 -2 -33 2 -2 -53 72 23 3 -64 Retained Earning Intangible and Goodwill Income Statement Dashboard and Reasoning Instructions 2012 2011 Retained Earning Schedule Year Retained Earnings (Previous Year) Net Income Stock Dividends Dividend Paid Retained Earnings 2020 86 16 -64 - 2019 72 IS 5 -5 86 2018 58 12 8 -6 2017 23 37 1 2016 3 20 2 2015 -17 21 2 2014 -33 16 2 -2 2013 -53 19 2 7 -70 6 -6 102 -4 58 -2 -33 2 -2 -53 72 23 3 -64
Step by Step Solution
There are 3 Steps involved in it

Get step-by-step solutions from verified subject matter experts