

Question: Check different sheets on this workbook. In the Dashboard and Reasoning sheet, create a dashboard that shows a summary of the companys financial statement. Compare
Check different sheets on this workbook. In the Dashboard and Reasoning sheet, create a dashboard that shows a summary of the companys financial statement. Compare the data provided on Retained Earning, Intangible and Goodwill and Income Statement sheets between the years of 2011 to 2020 and explain the best and the worst years for the company. Use at least one chart (choose the best chart type) to help you with the illustration. Write two paragraphs about the best and the worst years and explain your reasons as a business data analyst. Your two paragraphs together should not be less than 200 words. 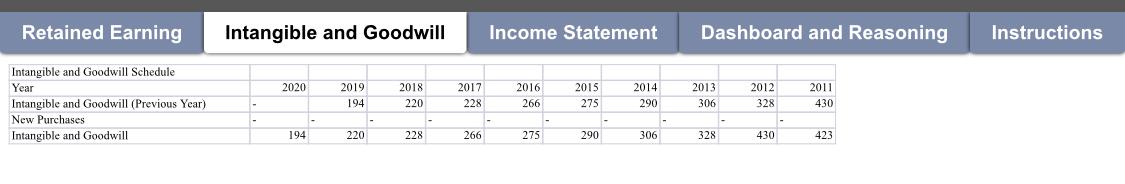
Retained Earning Intangible and Goodwill Income Statement Dashboard and Reasoning Instructions 2020 Intangible and Goodwill Schedule Year Intangible and Goodwill (Previous Year) New Purchases Intangible and Goodwill 2019 194 2018 220 2017 228 2016 266 2015 275 2014 290 2013 306 2012 328 2011 430 194 220 228 266 275 290 306 328 430 423 Retained Earning Intangible and Goodwill Income Statement Dashboard and Reasoning Instructions 2020 Intangible and Goodwill Schedule Year Intangible and Goodwill (Previous Year) New Purchases Intangible and Goodwill 2019 194 2018 220 2017 228 2016 266 2015 275 2014 290 2013 306 2012 328 2011 430 194 220 228 266 275 290 306 328 430 423
Step by Step Solution
There are 3 Steps involved in it

Get step-by-step solutions from verified subject matter experts