Question: Check My Work Spreadsheet E eBook The file P12_68.xlsx lists monthly and annual values of the average surface air temperature of the earth (in degrees
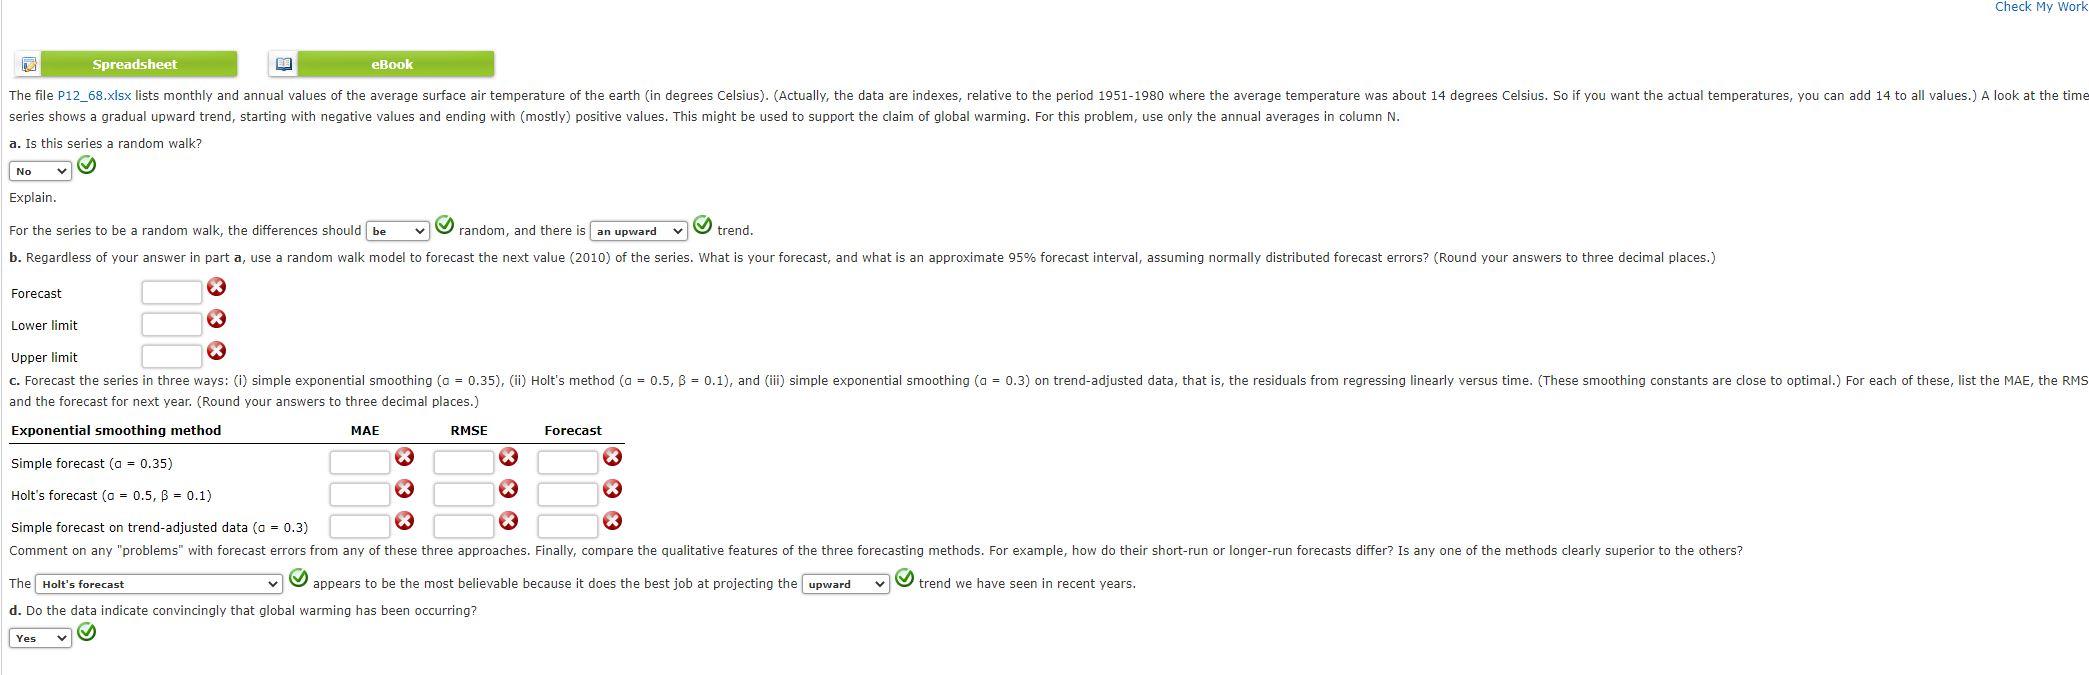
Check My Work Spreadsheet E eBook The file P12_68.xlsx lists monthly and annual values of the average surface air temperature of the earth (in degrees Celsius). (Actually, the data are indexes, relative to the period 1951-1980 where the average temperature was about 14 degrees Celsius. So if you want the actual temperatures, you can add 14 to all values.) A look at the time series shows a gradual upward trend, starting with negative values and ending with (mostly) positive values. This might be used to support the claim of global warming. For this problem, use only the annual averages in column N. a. Is this series a random walk? No Explain. V For the series to be a random walk, the differences should be random, and there is an upward trend. b. Regardless of your answer in part a, use a random walk model to forecast the next value (2010) of the series. What is your forecast, and what is an approximate 95% forecast interval, assuming normally distributed forecast errors? (Round your answers to three decimal places.) Forecast Lower limit Upper limit C. Forecast the series in three ways: (i) simple exponential smoothing (a = 0.35), (ii) Holt's method (a = 0.5, B = 0.1), and (iii) simple exponential smoothing (a = 0.3) on trend-adjusted data, that is, the residuals from regressing linearly versus time. (These smoothing constants are close to optimal.) For each of these, list the MAE, the RMS and the forecast for next year. (Round your answers to three decimal places.) Exponential smoothing method MAE RMSE Forecast Simple forecast (a = 0.35) Holt's forecast (a = 0.5, B = 0.1) Simple forecast on trend-adjusted data (a = 0.3) x Comment on any "problems with forecast errors from any of these three approaches. Finally, compare the qualitative features of the three forecasting methods. For example, how do their short-run or longer-run forecasts differ? Is any one of the methods clearly superior to the others? trend we have seen in recent years. The Holt's forecast appears to be the most believable because it does the best job at projecting the upward d. Do the data indicate convincingly that global warming has been occurring? Yes V


