

Check the following graph. This graph is the representation of a company's sales per month. Do you
Fantastic news! We've Found the answer you've been seeking!
Question:
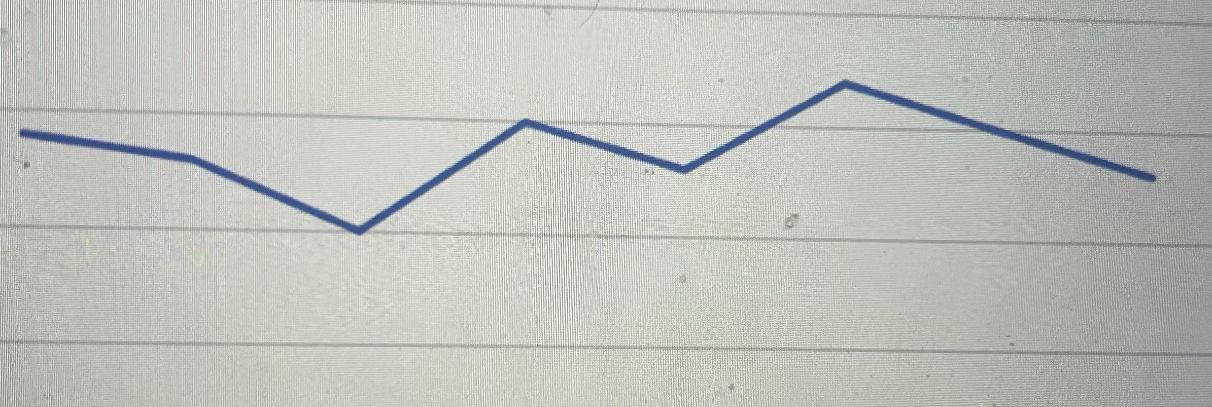
Check the following graph. This graph is the representation of a company's sales per month. Do you think there is a trend? what forecasting methods can we use in this case and why?
Expert Answer:
Yes there appears to be a trend in the graph The line goes up and down in a seasonal pattern suggest... View the full answer

Related Book For 

Financial Accounting and Reporting a Global Perspective
ISBN: 978-1408076866
4th edition
Authors: Michel Lebas, Herve Stolowy, Yuan Ding
Posted Date:
