

Question: Check the model from Question 3 (two factors) for the normality of error terms using a plot. Is the distribution normal? Attach the plot the
Check the model from Question 3 (two factors) for the normality of error terms using a plot. Is the distribution normal? Attach the plot
the question 3 mentioned in the text: Test for the effects of both A and B using two-way ANOVA. Report the p-values and state your conclusions from the test.
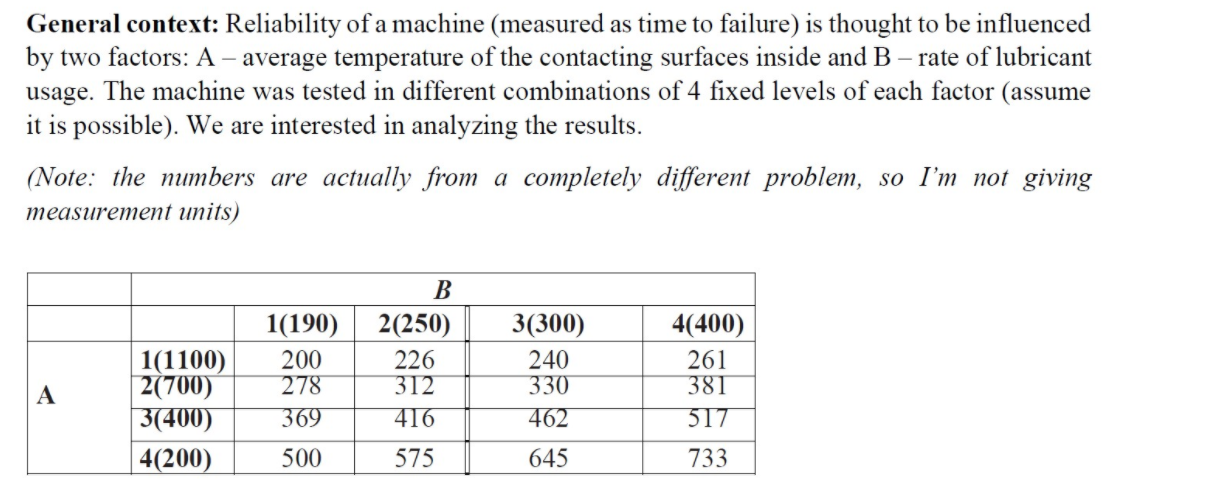
General context: Reliability of a machine (measured as time to failure) is thought to be influenced by two factors: A - average temperature of the contacting surfaces inside and B rate of lubricant usage. The machine was tested in different combinations of 4 fixed levels of each factor (assume it is possible). We are interested in analyzing the results. (Note: the numbers are actually from a completely different problem, so I'm not giving measurement units) 1(190) 200 278 369 1(1100) 2(700) 3(400) 4(200) B 2(250) 226 312 416 3(300) 240 330 462 4(400) 261 381 517 A 500 575 645 733 General context: Reliability of a machine (measured as time to failure) is thought to be influenced by two factors: A - average temperature of the contacting surfaces inside and B rate of lubricant usage. The machine was tested in different combinations of 4 fixed levels of each factor (assume it is possible). We are interested in analyzing the results. (Note: the numbers are actually from a completely different problem, so I'm not giving measurement units) 1(190) 200 278 369 1(1100) 2(700) 3(400) 4(200) B 2(250) 226 312 416 3(300) 240 330 462 4(400) 261 381 517 A 500 575 645 733Step by Step Solution
There are 3 Steps involved in it
1 Expert Approved Answer
Step: 1 Unlock

Question Has Been Solved by an Expert!
Get step-by-step solutions from verified subject matter experts
Step: 2 Unlock
Step: 3 Unlock