

Question: Checkout time at a grocery store is monitored using a range and mean chart. Seven samples (sample size =6 ) have been collected and the
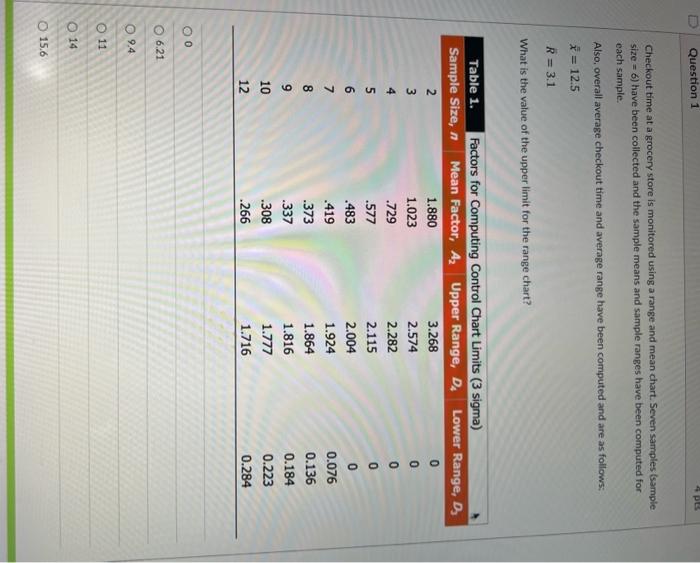
Checkout time at a grocery store is monitored using a range and mean chart. Seven samples (sample size =6 ) have been collected and the sample means and sample ranges have been computed for each sample. Also, overall average checkout time and average range have been computed and are as follows: x=12.5R=3.1 What is the value of the upper limit for the range chart? 11 14 15.6
Step by Step Solution
There are 3 Steps involved in it
1 Expert Approved Answer
Step: 1 Unlock

Question Has Been Solved by an Expert!
Get step-by-step solutions from verified subject matter experts
Step: 2 Unlock
Step: 3 Unlock