

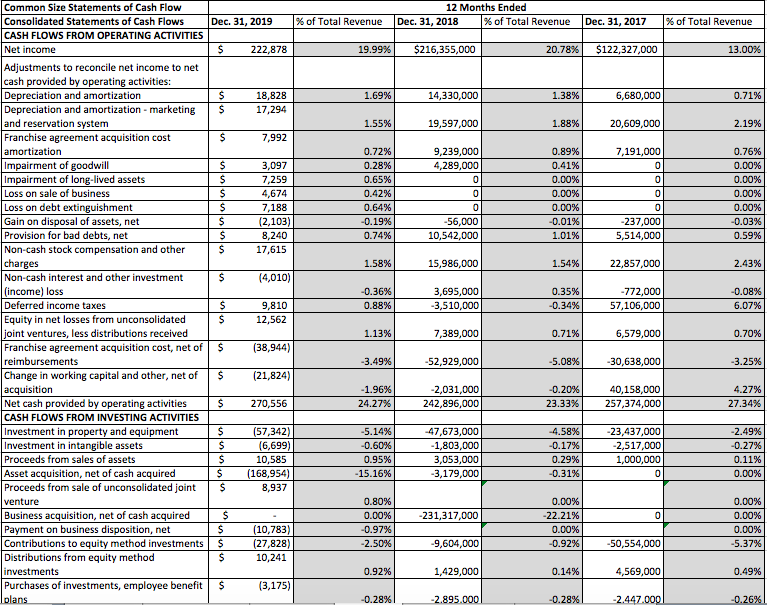
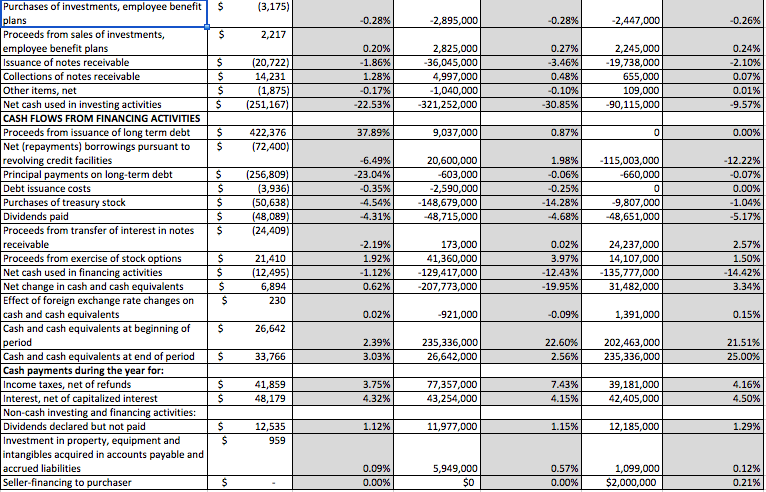
Question: Choice Hotels Cash Flow statement Marriott Cash Flow Statement 1. What were the two largest cash outflows for each company over the 3-year period? 2.
Choice Hotels Cash Flow statement
Marriott Cash Flow Statement
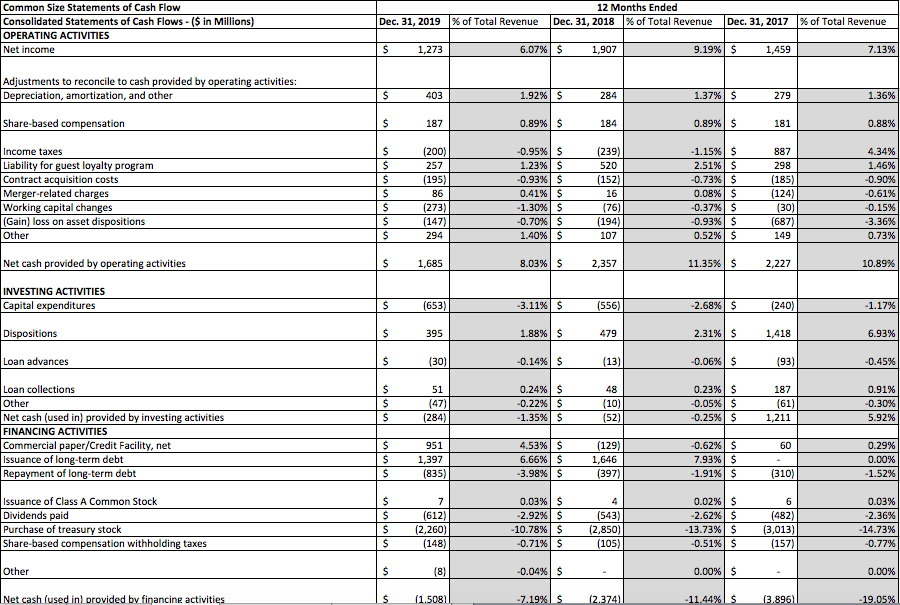
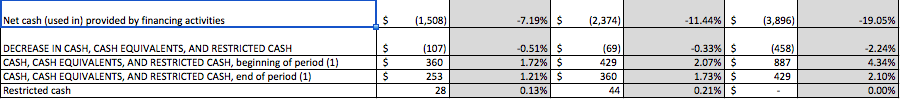
1. What were the two largest cash outflows for each company over the 3-year period?
2. What are the most significant trends for both companies?
12 Months Ended Dec. 31, 2018 % of Total Revenue Dec. 31, 2017 % of Total Revenue $216,355,000 20.78% $122,327,000 13.00% 14,330,000 1.38% 6,680,000 0.71% 19,597,000 1.88% 20,609,000 2.19% $ 7,191,000 9,239,000 4,289,000 0.89% 0.41% 0.00% 0.00% 0.00% -0.01% 1.01% 0 01 ol 0 -56,000 10,542,000 0.76% 0.00% 0.00% 0.00% 0.00% -0.03% 0.59% -237,000 5,514,000 15,986,000 1.54% 22,857,000 2.43% Common Size Statements of Cash Flow Consolidated Statements of Cash Flows Dec. 31, 2019 % of Total Revenue CASH FLOWS FROM OPERATING ACTIVITIES Net income S 222,878 19.99% Adjustments to reconcile net income to net cash provided by operating activities: Depreciation and amortization | $ 18,828 1.69% Depreciation and amortization - marketing $ 17,294 and reservation system 1.55% Franchise agreement acquisition cost 7,992 amortization 0.72% Impairment of goodwill $ 3,097 0.28% Impairment of long-lived assets $ 7,259 0.65% Loss on sale of business S 4,674 0.42% Loss on debt extinguishment $ 7,188 0.64% Gain on disposal of assets, net $ (2,103) Provision for bad debts, net | $ 8,240 0.74% Non-cash stock compensation and other IS 17,615 charges 1.58% Non-cash interest and other investment 1 $ (4,010) (income) loss -0.36% Deferred income taxes S 9,810 0.88% Equity in net losses from unconsolidated $ 12,562 joint ventures, less distributions received 1.13% Franchise agreement acquisition cost, net of $ (38,944)|| reimbursements -3.49% Change in working capital and other, net of $ (21,824) acquisition -1.96% Net cash provided by operating activities $ 270,556 24.27% CASH FLOWS FROM INVESTING ACTIVITIES Investment in property and equipment $ (57,342)| -5.14% Investment in intangible assets S (6,699) | -0.60% Proceeds from sales of assets $ 10,585 0.95% Asset acquisition, net of cash acquired $ (168,954) -15.16% Proceeds from sale of unconsolidated joint $ 8,937 venture 0.80% Business acquisition, net of cash acquired S . 0.00% Payment on business disposition, net $ (10,783) -0.97% Contributions to equity method investments $ (27,828) -2.50% Distributions from equity method investments 0.92% Purchases of investments, employee benefit 13.1751 plans 3,695,000 -3,510,000 0.35% -0.34% -772,000 57,106,000 -0.08% 6.07% 7,389,000 0.71% 6,579,000 0.70% -52,929,000 -5.08% 5.08% -30,638,000 30.628,00 -3.25% -2,031,000 242,896,000 -0.20% 23.33% 40,158,000 257,374,000 4.27% 27.34% 47,673,000 -1,803,000 3,053,000 -3,179,000 -4.58% -0.17% 0.29% -0.31% -23,437,000 -2,517,000 1,000,000 -2.49% -0.27% 0.11% 0.00% -231,317,000 0.00% -22.21% 0.00% -0.92% 0.00% 0.00% 0.00% -5.37% -9,604,000 -50,554,000 10,241 1,429,000 0.14% 4,569,000 0.49% -0.28% -2.895.000 -0.28% -2.447.000 -0.26% 3,175) -0.28% -2,895,000 -0.28% -2,447,000 -0.26% 2,217 (20,722) 14,231 (1,875) (251,167) 0.20% -1.86% 1.28% -0.17% -22.53% 2,825,000 -36,045,000 4,997,000 -1,040,000 -321,252,000 0.27% 3.46% 0.48% -0.10% -30.85% 2,245,000 -19,738,000 655,000 109,000 -90,115,000 0.24% -2.10% 0.07% 0.01% -9.57% 37.89% 9,037,000 0.87% 0 0.00% 422,376 (72,400) (256,809) (3,936) (50,638) (48,089) (24,409) -6.49% -23.04% -0.35% -4.54% -4.31% 20,600,000 -603,000 -2,590,000 -148,679,000 48,715,000 1.98% -0.06% -0.25% -14.28% -4.68% 115,003,000 660,000 0 -9,807,000 -48,651,000 12 27% -0.07% 0.00% -1.04% -5.17% Purchases of investments, employee benefit $ plans Proceeds from sales of investments, I $ employee benefit plans Issuance of notes receivable S Collections of notes receivable $ Other items, net $ Net cash used in investing activities S CASH FLOWS FROM FINANCING ACTIVITIES Proceeds from issuance of long term debt $ Net (repayments) borrowings pursuant to $ revolving credit facilities Principal payments on long-term debt $ Debt issuance costs $ Purchases of treasury stock $ Dividends paid $ Proceeds from transfer of interest in notes $ receivable Proceeds from exercise of stock options | $ Net cash used in financing activities $ Net change in cash and cash equivalents $ Effect of foreign exchange rate changes on $ cash and cash equivalents Cash and cash equivalents at beginning of $ period Cash and cash equivalents at end of period $ Cash payments during the year for: Income taxes, net of refunds $ Interest, net of capitalized interest | $ | $ Non-cash investing and financing activities: Dividends declared but not paid $ Investment in property, equipment and $ intangibles acquired in accounts payable and accrued liabilities Seller-financing to purchaser $ 21,410 (12,495) 6,894 230 -2.19% 1.92% -1.12% 0.62% 173,000 41,360,000 -129,417,000 -207,773,000 0.02% 3.97% -12.43% -19.95% 24,237,000 14,107,000 -135,777,000 31,482,000 2.57% 1.50% -14.42% 14 A 3.34% 0.02% -921,000 -0.09% 1,391,000 0.15% 26,642 2.39% 3.03% 235,336,000 26,642,000 22.60% 2.56% 202,463,000 235,336,000 21.51% 25.00% 33,766 41,859 48,179 48,179 3.75% 4.32% 4.32% 77,357,000 43,254,000 7.43% 4.15% 39,181,000 42,405,000 4.16% 4.50% 1.12% 11,977,000 1.15% 12,185,000 1.29% 12,535 959 0.09% 0.00% 5,949,000 $0 0.57% 0.00% | 1,099,000 $2,000,000 0.12% 0.21% 12 Months Ended Dec. 31, 2018 % of Total Revenue Dec. 31, 2019 % of Total Revenue Dec. 31, 2017 % of Total Revenue Common Size Statements of Cash Flow Consolidated Statements of Cash Flows - ($ in Millions) OPERATING ACTIVITIES Net income $ 1,273 6.07% $ 1,907 9.19% $ 1,459 7.13% Adjustments to reconcile to cash provided by operating activities: Depreciation, amortization, and other 403 1.92% S 284 1.37% S 279 1.36% Share-based compensation 187 0.89% $ 184 0.89% $ 181 0.88% $ -1.15% 2.51% $ $ $ Income taxes Liability for euest lovalty proEram Contract acquisition costs Merger-related charges Working capital changes (Gain) loss on asset dispositions Other (200) 257 (195) 86 (273)| (147) 294 -0.95% 1.23% S -0.93% 0.41% -1.30% -0.70% 1.40% $ $ $ $ $ (239) 520 (152) 16 (76) (194) 107 0.08% -0.37% -0.93% 0.52% $ $ $ $ 887 298 (185) (124) (30)| (687) 149 4.34% 1.46% 0.90% -0.61% -0.15% -3.36% 0.73% Net cash provided by operating activities S 1,685 8.03% $ 2,357 11.35% $ 2,227 10.89% INVESTING ACTIVITIES Capital expenditures (653) -3.11% $ (556) -2.68% $ (240) - 1.17% Dispositions 395 1.88% $ 479 2.31% $ 1,418 6.93% Loan advances (30) -0.14% $ (13) -0.06% $ (93) -0.45% S $ 51 (47) (284) 0.24% -0.22% -1.35% $ $ $ 48 (10) (52) 0.23% -0.05% -0.25% $ $ $ 187 (61) 1,211 0.91% -0.30% 5.92% Loan collections Other Net cash (used in provided by investing activities FINANCING ACTIVITIES Commercial paper/Credit Facility, net Issuance of long-term debt Repayment of long-term debt $ $ $ 951 1,397 (835) 4.53% 6.66% -3.98% $ $ $ (129) 1,646 (397) -0.62% 7.93% -1.91% $ $ $ 60 - (310) 0.29% 0.00% -1.52% Issuance of Class A Common Stock Dividends paid Purchase of treasury stock Share-based compensation withholding taxes $ $ $ $ 7 (612) (2,260) (148) 0.03% -2.92% -10.78% -0.71% $ $ $ $ (543) (2,850) (105) 0.02% -2.62% -13.73% -0.51% $ $ $ $ 6 (482) (3,013) (157) 0.03% -2.36% -14.73% -0.77% Other S (8) -0.04% $ . 0.00% $ - 0.00% Net cash (used in provided by financine activities $ (1.508) -7.19% (2.374| - 11.44% $ (3,896) -19.05% Net cash (used in provided by financing activities 1$ (1,508) -7.19% $ (2,374) -11.44% $ (3,896) -19.05% DECREASE IN CASH, CASH EQUIVALENTS, AND RESTRICTED CASH CASH, CASH EQUIVALENTS, AND RESTRICTED CASH, beginning of period (1) CASH, CASH EQUIVALENTS, AND RESTRICTED CASH, end of period (1) Restricted cash IS $ $ (107) 360 253 28 -0.51% 1.72% 1.21% 0.13% $ $ $ (69) 429 360 -0.33% 2.07% 1.73% 0.21% $ $ $ $ (458) 887 429 -2.24% 4.34% 2.10% 0.00%
Step by Step Solution
There are 3 Steps involved in it

Get step-by-step solutions from verified subject matter experts