

Question: Choose an appropriate scale and plot a Force vs. Displacement graph (that's Force on the y and Displacement on the xvaxis) using your data from
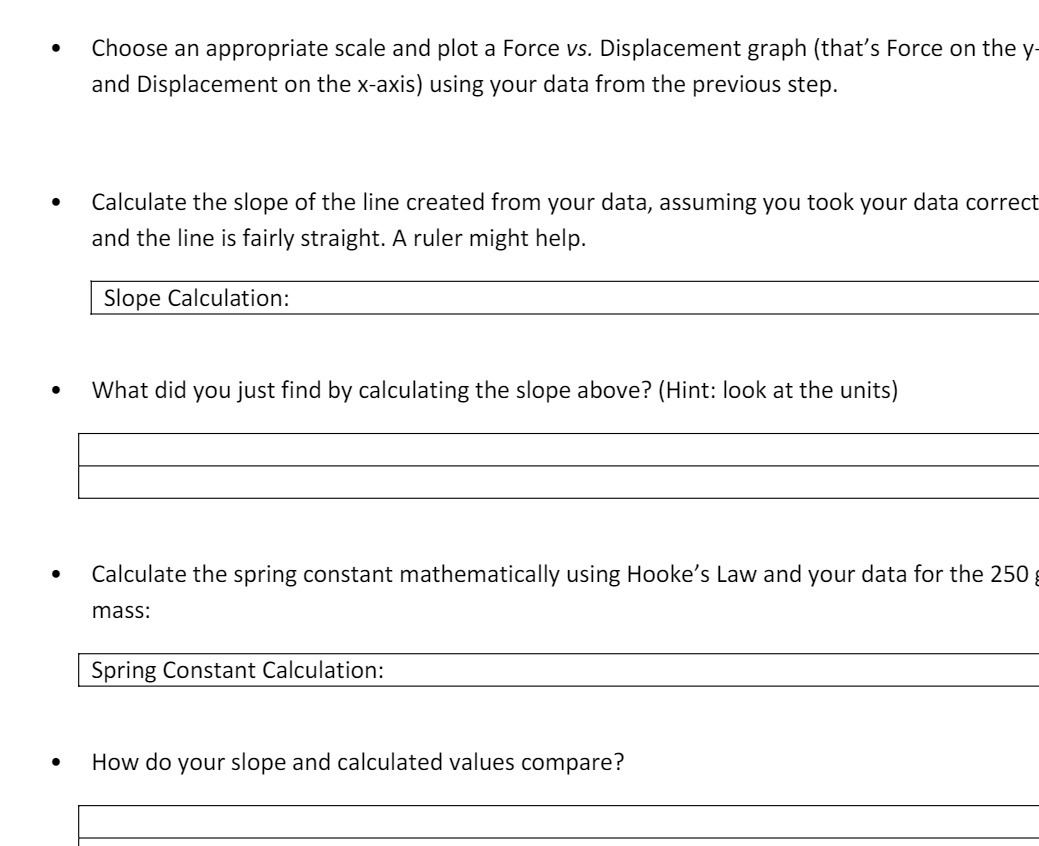
Choose an appropriate scale and plot a Force vs. Displacement graph (that's Force on the y and Displacement on the xvaxis) using your data from the previous step. Calculate the slope of the line created from your data, assuming you took your data correct and the line is fairly straight. A ruler might help. I Slope Calculation: What did you just find by calculating the slope above? (Hint: look at the units) : Calculate the spring constant mathematically using Hooke's Law and your data for the 250 g mass: Spring Constant Calculation: How do your slope and calculated values compare
Step by Step Solution
There are 3 Steps involved in it
1 Expert Approved Answer
Step: 1 Unlock

Question Has Been Solved by an Expert!
Get step-by-step solutions from verified subject matter experts
Step: 2 Unlock
Step: 3 Unlock