

Question: Choose Boxplot A, B, C, D This histogram shows the percentage of the population that smokes tobacco for 123 countries. 31 30 - 26 27
Choose Boxplot A, B, C, D
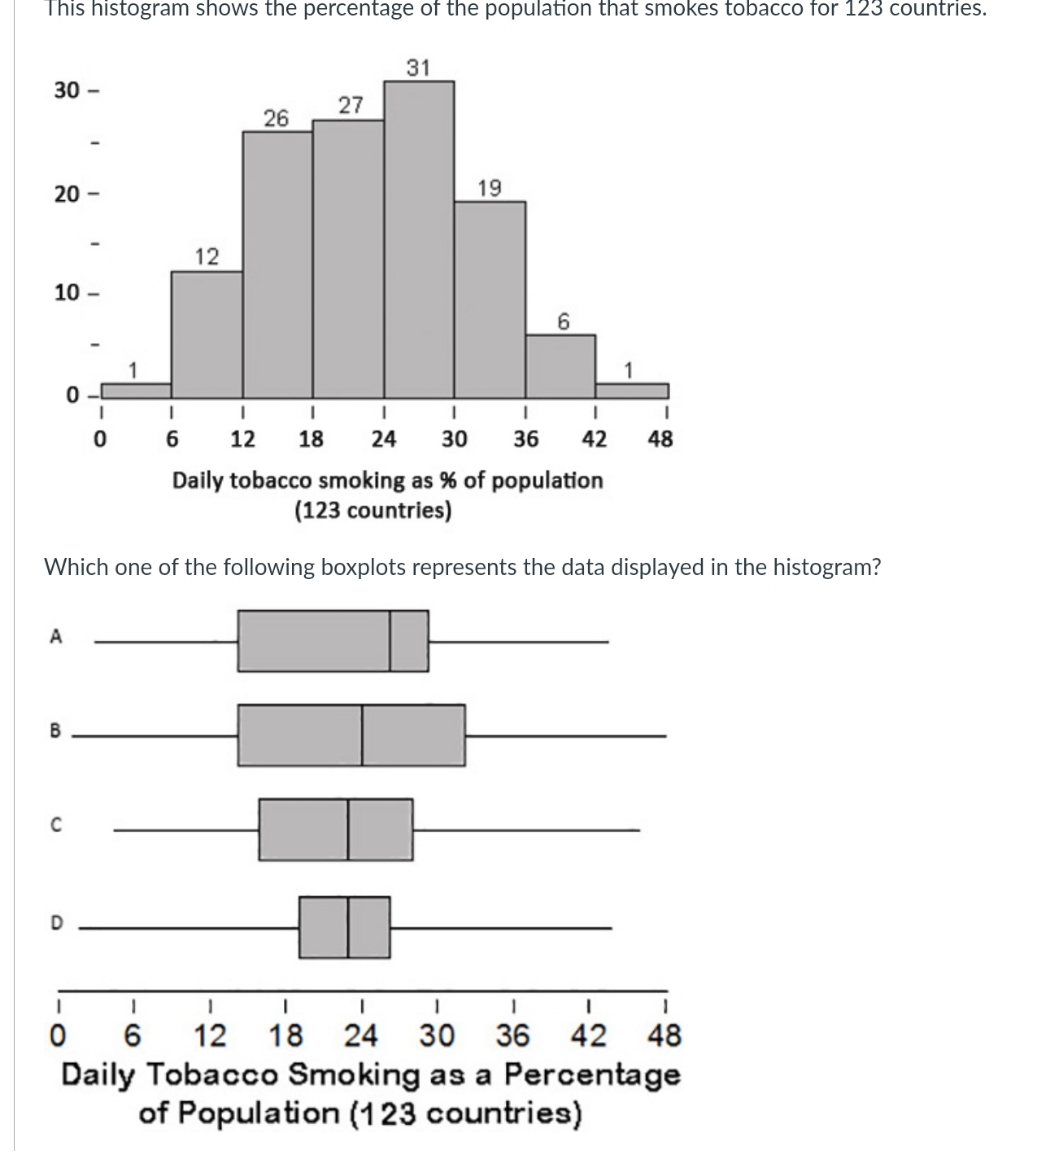
This histogram shows the percentage of the population that smokes tobacco for 123 countries. 31 30 - 26 27 20 - 19 12 10 - 6 6 12 18 24 30 36 42 48 Daily tobacco smoking as % of population (123 countries) Which one of the following boxplots represents the data displayed in the histogram? 0 6 12 18 24 30 36 42 48 Daily Tobacco Smoking as a Percentage of Population (123 countries)
Step by Step Solution
There are 3 Steps involved in it
1 Expert Approved Answer
Step: 1 Unlock

Question Has Been Solved by an Expert!
Get step-by-step solutions from verified subject matter experts
Step: 2 Unlock
Step: 3 Unlock