

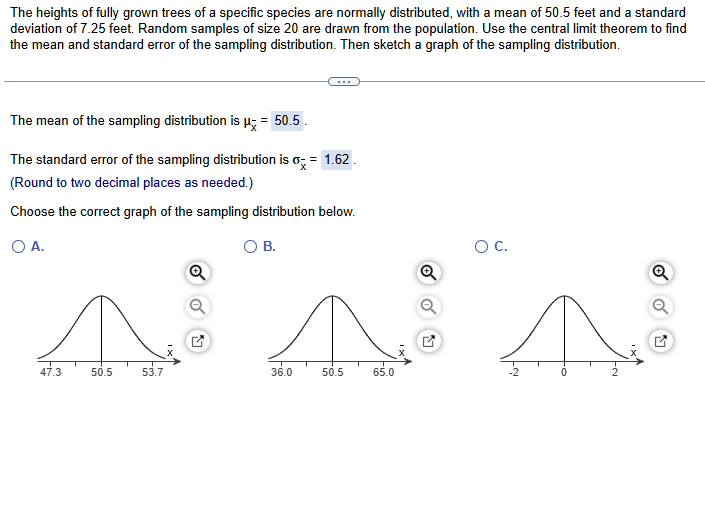
Question: Choose the correct graph of the sampling distribution below. The heights of fully grown trees of a specific species are normally distributed, with a mean
Choose the correct graph of the sampling distribution below.
Step by Step Solution
There are 3 Steps involved in it
1 Expert Approved Answer
Step: 1 Unlock

Question Has Been Solved by an Expert!
Get step-by-step solutions from verified subject matter experts
Step: 2 Unlock
Step: 3 Unlock