

Question: Chrome File Edit View History Bookmarks People Window Help Login x Conten x C Use Ma x x final qu x @ Econ CI x
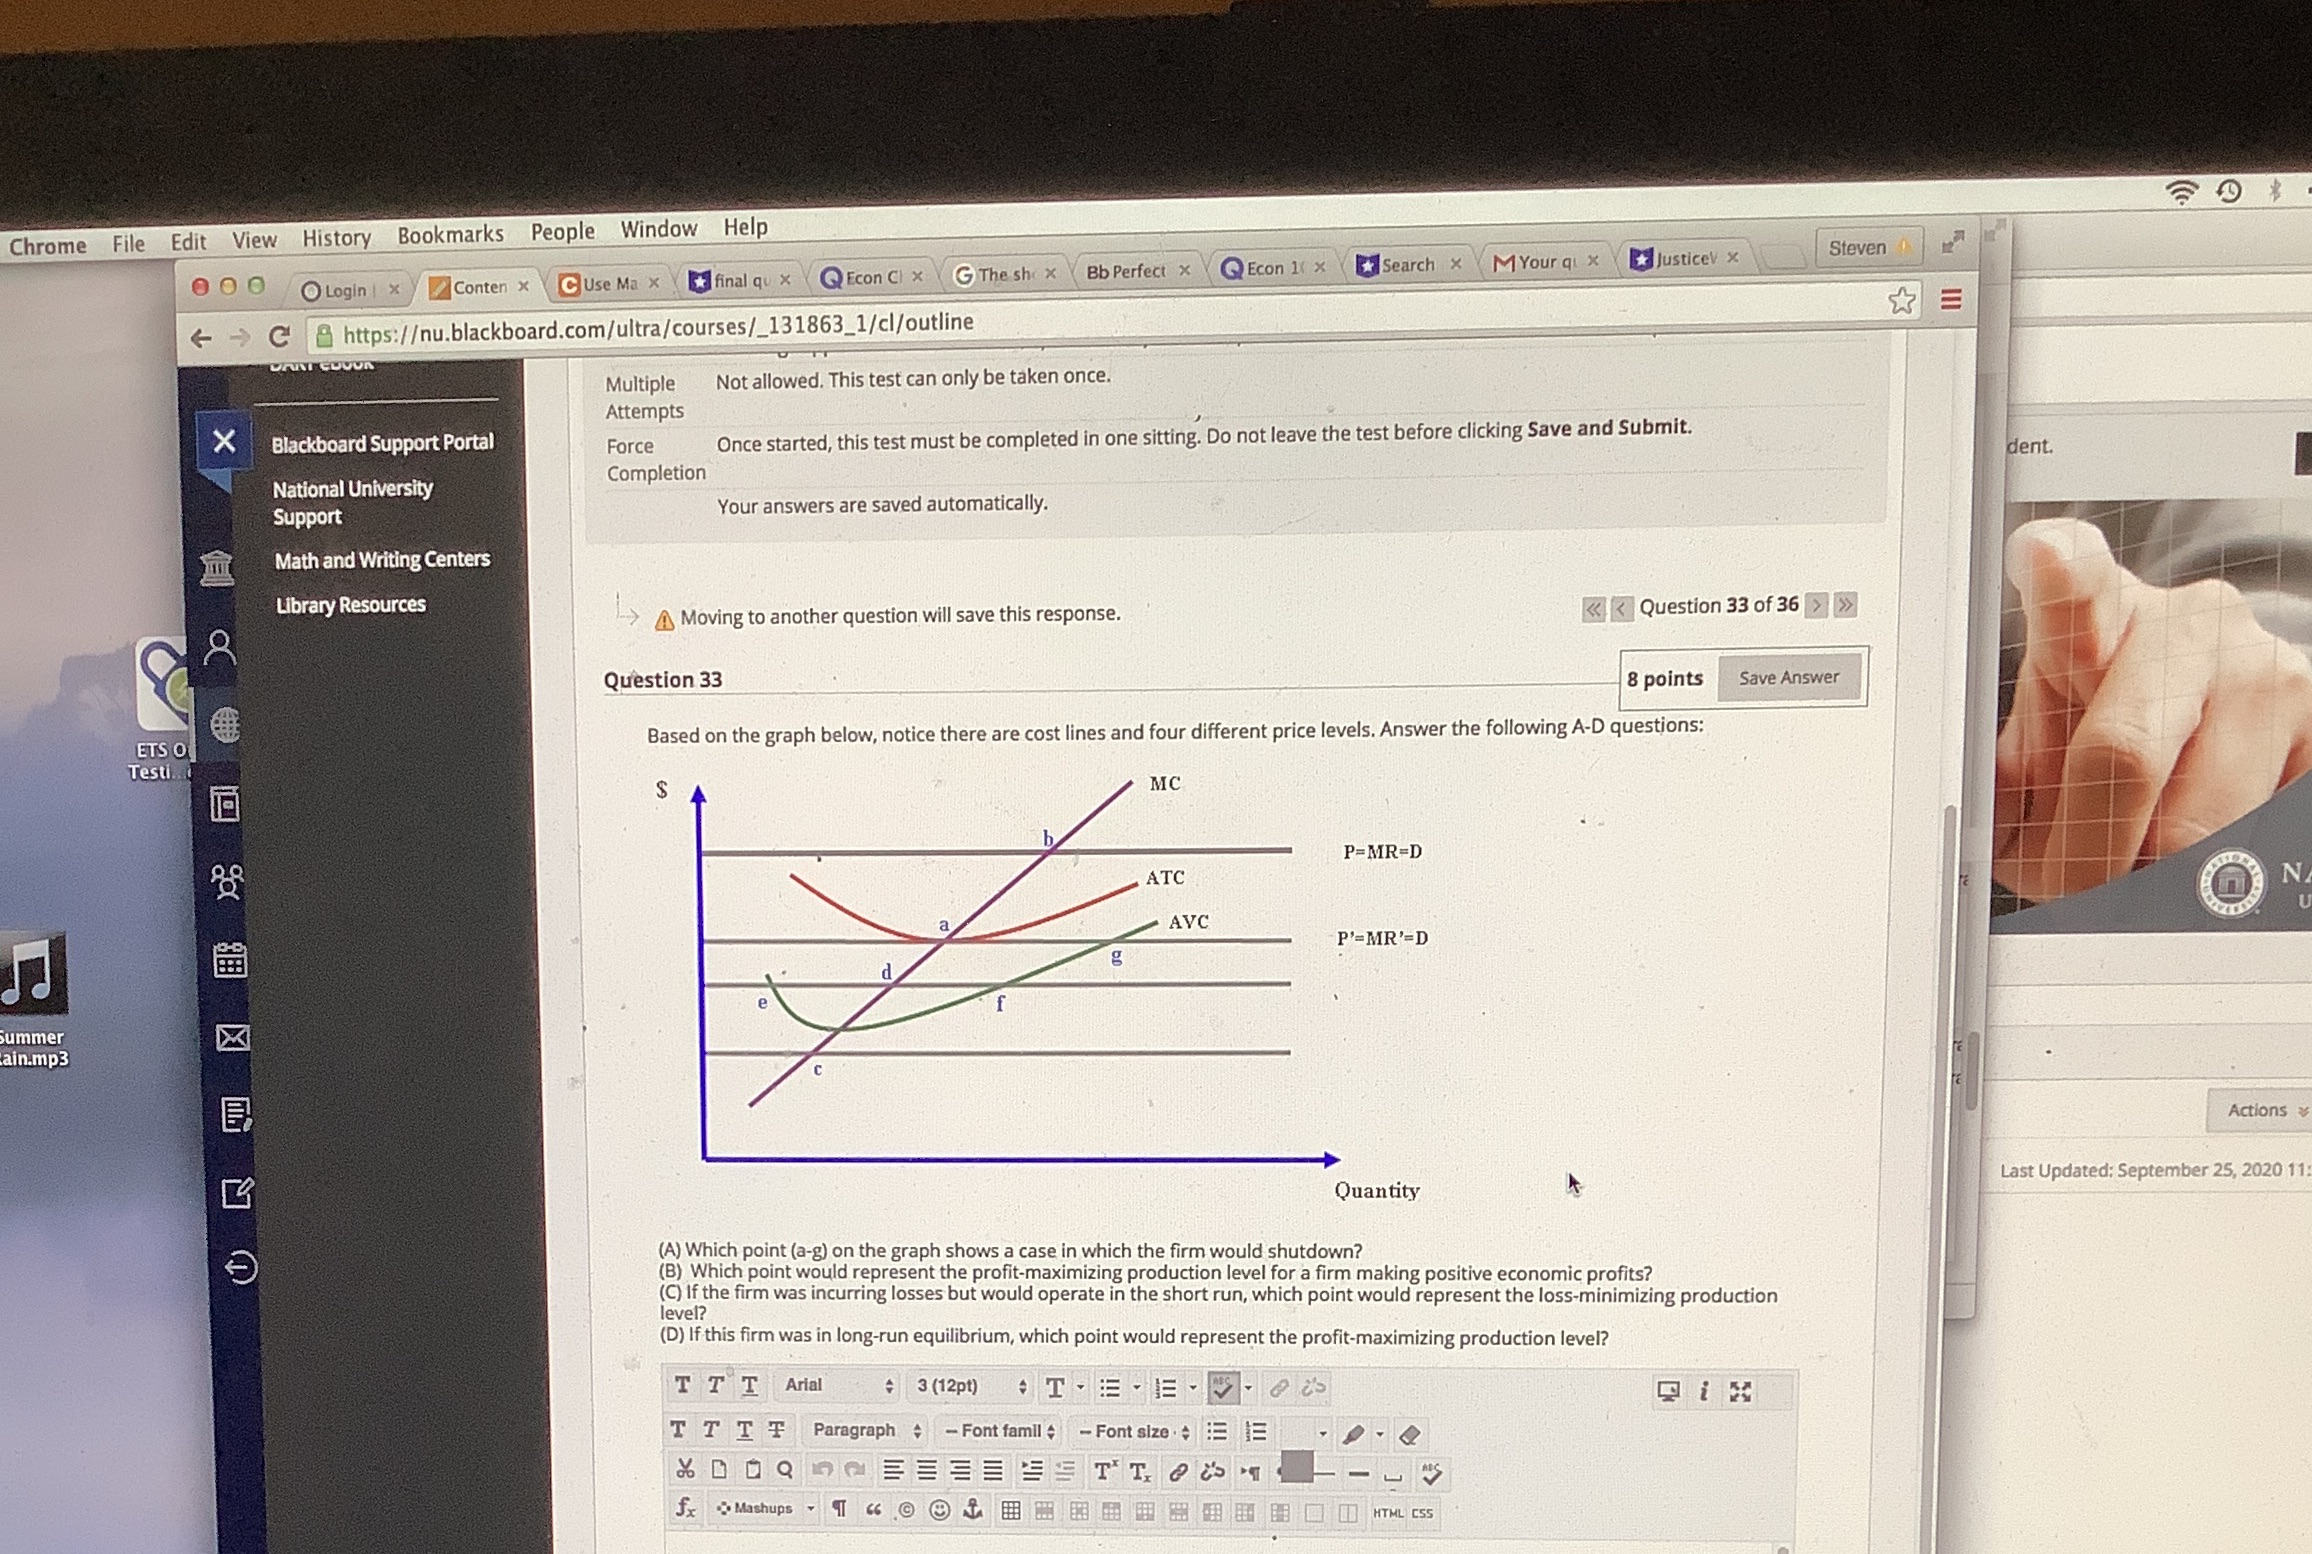
Chrome File Edit View History Bookmarks People Window Help Login x Conten x C Use Ma x x final qu x @ Econ CI x GThe shox Bb Perfect x \\ Econ 11 x search x \\M Your q x justicev x Steven - C & https:/u.blackboard.com/ultra/courses/_131863_1/cl/outline E Multiple Not allowed. This test can only be taken once. X Attempts Blackboard Support Portal Force Once started, this test must be completed in one sitting. Do not leave the test before clicking Save and Submit. National University completion dent. Support Your answers are saved automatically. Math and Writing Centers Library Resources 8 -> Moving to another question will save this response. | > Question 33 8 points Save Answer ETS O Testi. . Based on the graph below, notice there are cost lines and four different price levels. Answer the following A-D questions: MC P=MR=D ATC AVC O N g P'=MR'=D Summer ain.mp3 X Actions Quantity Last Updated: September 25, 2020 1 (A) Which point (a-g) on the graph shows a case in which the firm would shutdown? (B) Which point would represent the profit-maximizing production level for a firm making positive economic profits? C) If the firm was incurring losses but would operate in the short run, which point would represent the loss-minimizing production level? (D) If this firm was in long-run equilibrium, which point would represent the profit-maximizing production level? T TT Arial 3 (12p1) . T - - Qu T TT F Paragraph + - Font familyont size . fx Mashups - 4: CSS
Step by Step Solution
There are 3 Steps involved in it

Get step-by-step solutions from verified subject matter experts