

Question: Chrome File Edit View History Bookmarks Profiles Tab Window Help Sat Apr 2 8:21 PM Y C Tools Data Wincion YI Excel File x +
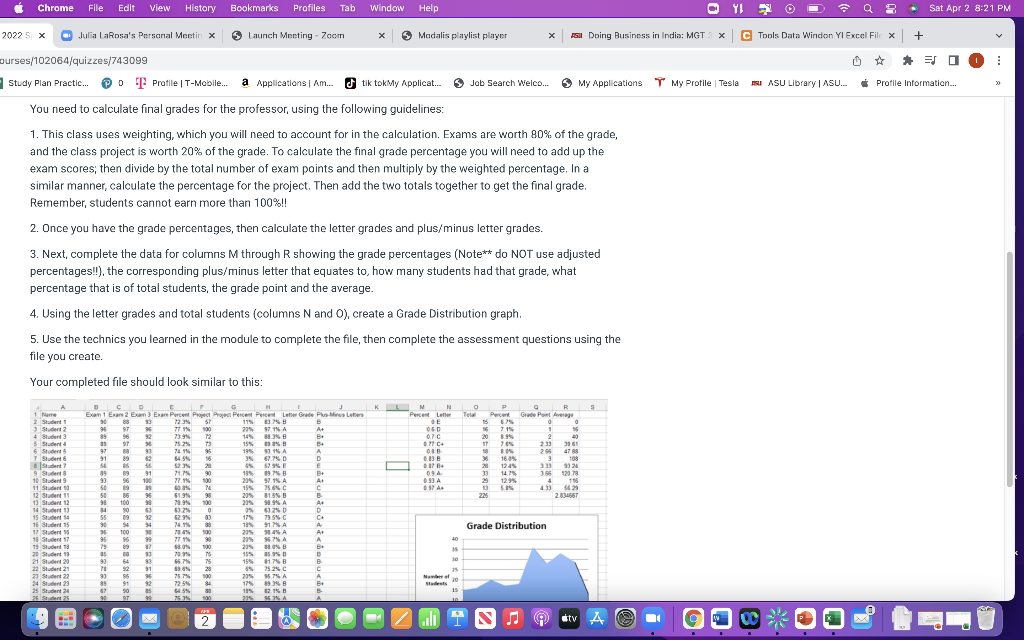
Chrome File Edit View History Bookmarks Profiles Tab Window Help Sat Apr 2 8:21 PM Y C Tools Data Wincion YI Excel File x + 2022 S x Julia LaRosa's Personal Meetin x 3 - Launch Meeting - Zoom 3 Modalis playlist player X AS. Doing Business in India: MGT X Durses/102064/quizzes/743099 ET 1 0 . Study Plan Practic... O T Profile | T-Mobile... | a Applications Am... tik tokMy Applicat... Job Search Welco... My Applications TMy Profile Tesla SU ASU Library | ASU... Profile Information... 30 You need to calculate final grades for the professor, using the following guidelines: 1. This class uses weighting, which you will need to account for in the calculation. Exams are worth 80% of the grade, and the class project is worth 20% of the grade. To calculate the final grade percentage you will need to add up the exam scores; then divide by the total number of exam points and then multiply by the weighted percentage. In a similar manner, calculate the percentage for the project. Then add the two totals together to get the final grade. Remember, students cannot earn more than 100%!! 2. Once you have the grade percentages, then calculate the letter grades and plus/minus letter grades. 3. Next, complete the data for columns M through R showing the grade percentages (Note** do NOT use adjusted percentages!!), the corresponding plus/minus letter that equates to, how many students had that grade, what percentage that is of total students, the grade point and the average. 4. Using the letter grades and total students (columns N and 0), create a Grade Distribution graph. 5. Use the technics you learned in the module to complete the file, then complete the assessment questions using the file you create. Your completed file should look similar to this: K L M N Perce Late OE 06D 0.70 OPTC o o R Parco Grade Port Average O 0 56 715 1 156 20 8.99 2 ST 233 3151 295 47 16.09 108 2 1235 31 9324 33 3.96 2978 23 12.9% 4 116 225 234567 17 09 . A As H ture Exen 1 Exam 2 Exam 3 Exam Percent Project Project Percent Purces Lender Grade PlusMinus Letters 2 Student 1 90 80 93 3 Student 2 19533198 ST 100 205 A At 4 Student 899632 73.95 72 83 B 5 Student 3997 2525 73 1550 B 6 S 9741 RR 93 74 199 999 A 7 Students 91 89 4.596 16 31D D St 5 621 20 65295 E 9 Sunt 899119 13948 + 93 56 100 77.7% 100 209.16A A. 11 S 50 19 60 M 155 SSC C 2 Student 110 16 19% 36 61.95 90 295 159 13 Student 12 98 100 98 189 190 2959 A A. 14 Student 1) 403250 0925D D 15 Student 55 19 92 62.9% 175 5% 16 Student 15 C+ 9 19 54 4 1991A A 17 Student 100 100 2054A Ae 11 Student 17 95 95 99 77. 90 20% NA A 19 Sludert 18997805100 60 20 80% B Be 20 Student 15 20 25 % 13 B 21 Student 29934 20 93 65. 75 1551 22 Student 21 721 31 09 2524 C c 23 Student 22 91 75.7% 295 A A 24 Sun 23 899132 72.5% 34 175893 B 25 Student24 671005 as H 1352 25 Scan 25 90 ST 99 75 500 205 SA Grade Distribution 40 30 Sudents 15 Gli N dity A
Step by Step Solution
There are 3 Steps involved in it

Get step-by-step solutions from verified subject matter experts