

Question: Chrome File Edit View History Bookmarks Profiles Tab Window Help Q Fri Jun 28 4:08PM Logout X = 4.3 No X Easy H X Read:
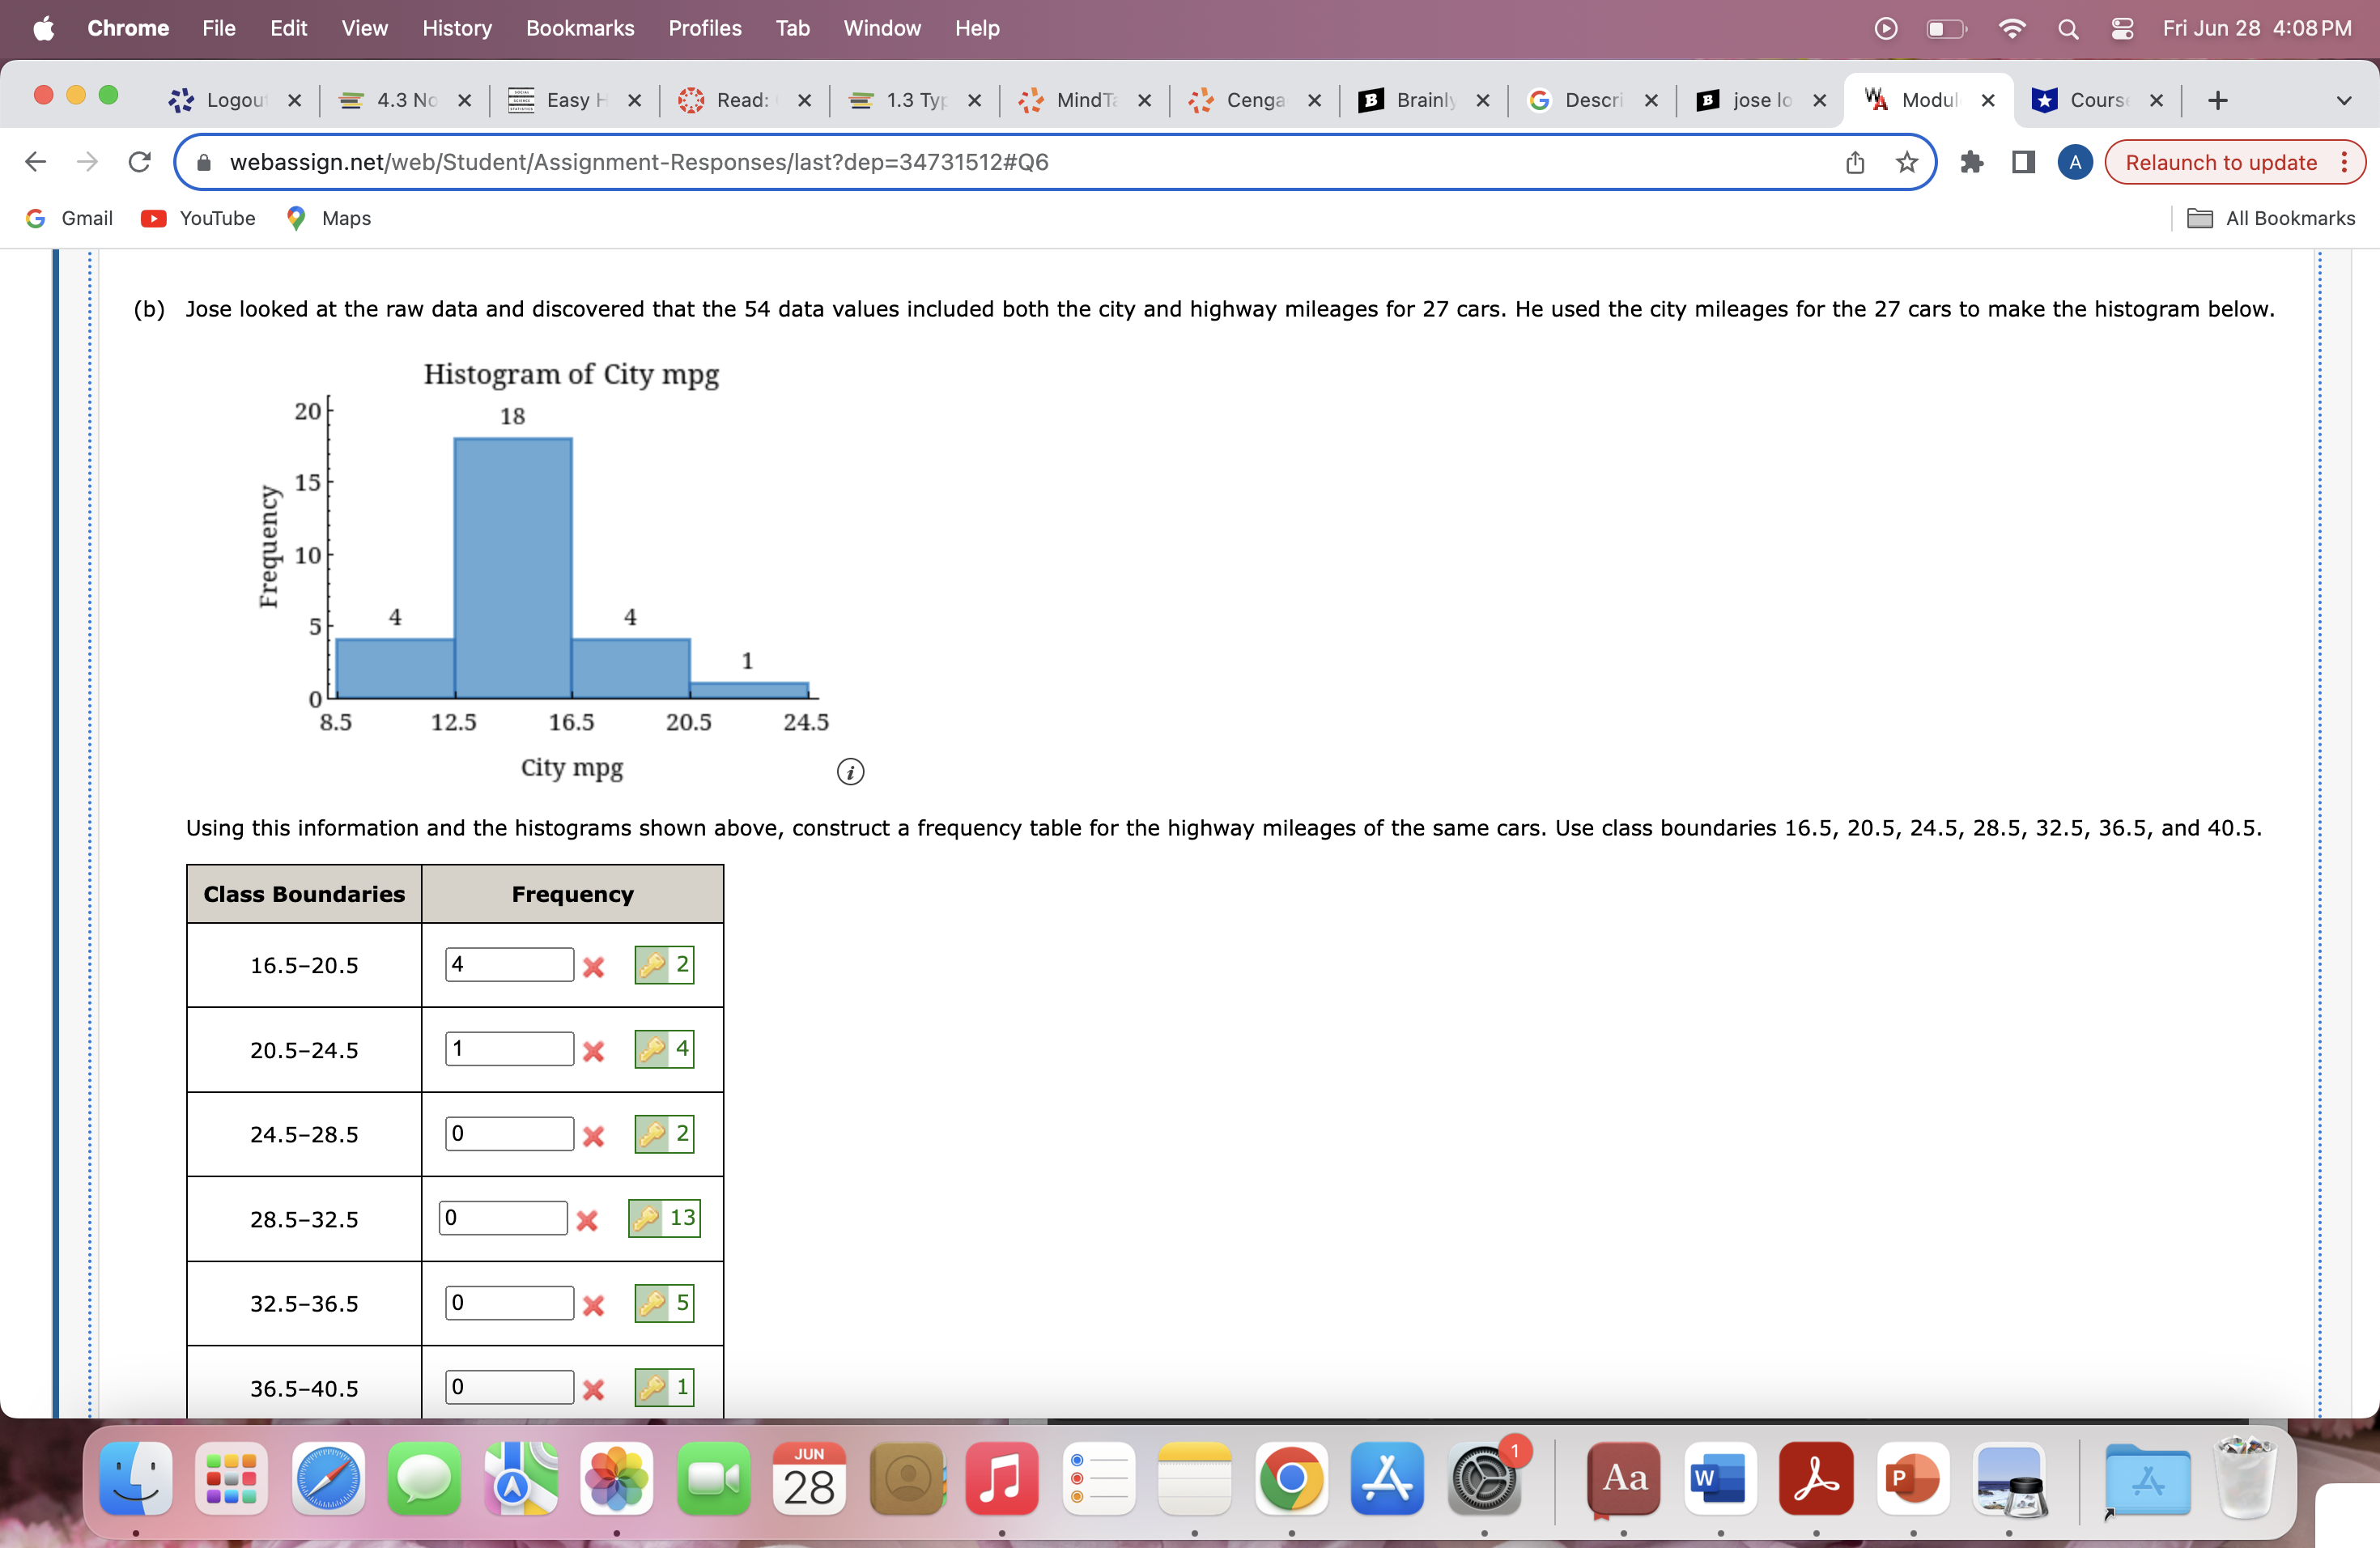
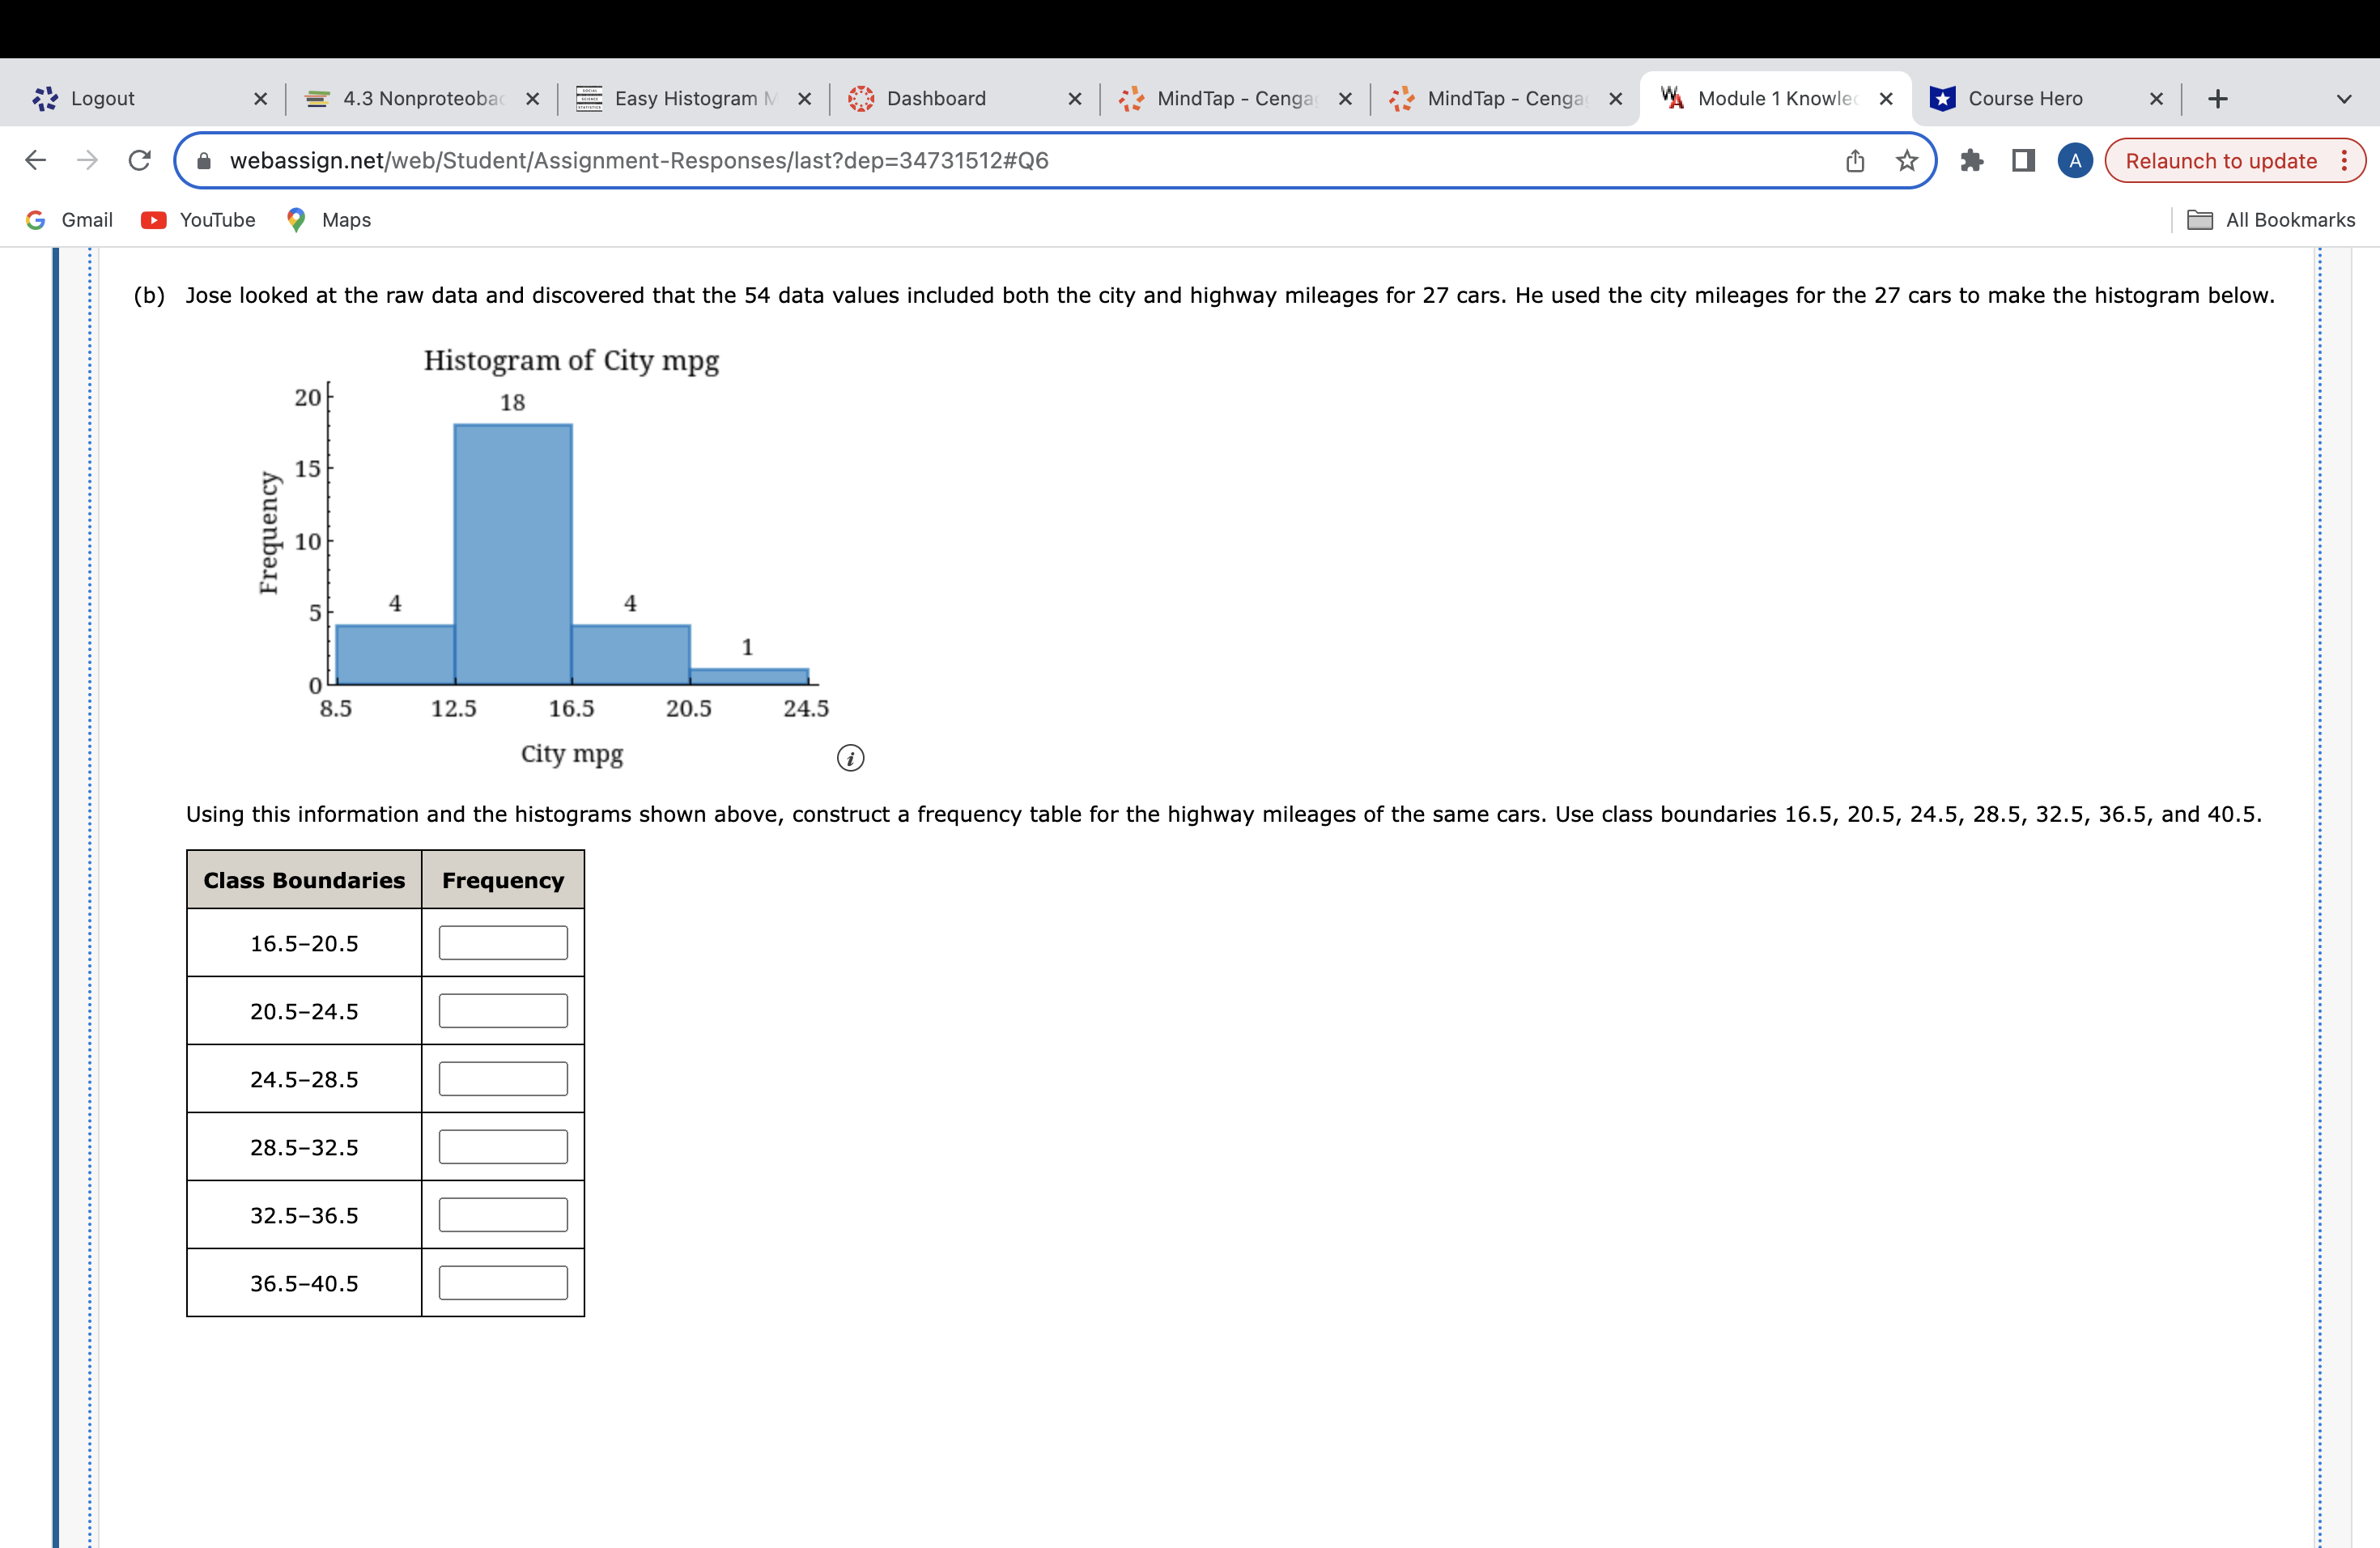
Chrome File Edit View History Bookmarks Profiles Tab Window Help Q Fri Jun 28 4:08PM Logout X = 4.3 No X Easy H X Read: x = 1.3 Tyr X MindT X Cenga x B Brainly x G Descri X B jose lo X A Modul X Cours( X + C webassign.net/web/Student/Assignment-Responses/last?dep=34731512#Q6 Relaunch to update G Gmail YouTube Maps All Bookmarks (b) Jose looked at the raw data and discovered that the 54 data values included both the city and highway mileages for 27 cars. He used the city mileages for the 27 cars to make the histogram below. Histogram of City mpg 20 18 15 Frequency 10 5 4 10 8.5 12.5 16.5 20.5 24.5 City mpg Using this information and the histograms shown above, construct a frequency table for the highway mileages of the same cars. Use class boundaries 16.5, 20.5, 24.5, 28.5, 32.5, 36.5, and 40.5. Class Boundaries Frequency 16.5-20.5 4 x 9 2 20.5-24.5 1 X 9 4 24.5-28.5 0 X 9 2 28.5-32.5 0 x 13 . . . . ...................................... 32.5-36.5 0 x 9 5 . . . . ....... 36.5-40.5 0 x 9 1 JUN 28 4 Aa w [PDashboard X ~
Step by Step Solution
There are 3 Steps involved in it

Get step-by-step solutions from verified subject matter experts