

Question: circle the answer please 28 (1994.27.7) 26 The graph provides a good approximation of the number of food stamp recipients (in Millions) from 1994 through
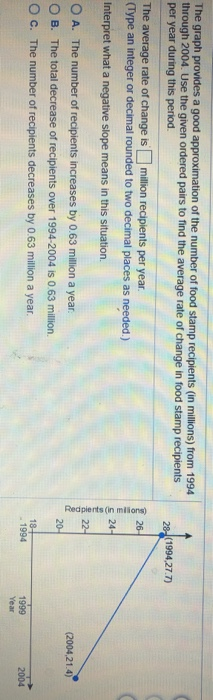
28 (1994.27.7) 26 The graph provides a good approximation of the number of food stamp recipients (in Millions) from 1994 through 2004. Use the given ordered pairs to find the average rate of change in food stamp recipients per year during this period The average rate of change is million recipients per year. (Type an integer or decimal rounded to two decimal places as needed.) Interpret what a negative slope means in this situation. O A. The number of recipients increases by 0.63 million a year. O B. The total decrease of recipients over 1994-2004 is 0.63 million. O C. The number of recipients decreases by 0.63 million a year. Redpients (in milions) 24- 22- (2004,21.4) 20- 18+ 1994 2004 1999 Year
Step by Step Solution
There are 3 Steps involved in it

Get step-by-step solutions from verified subject matter experts