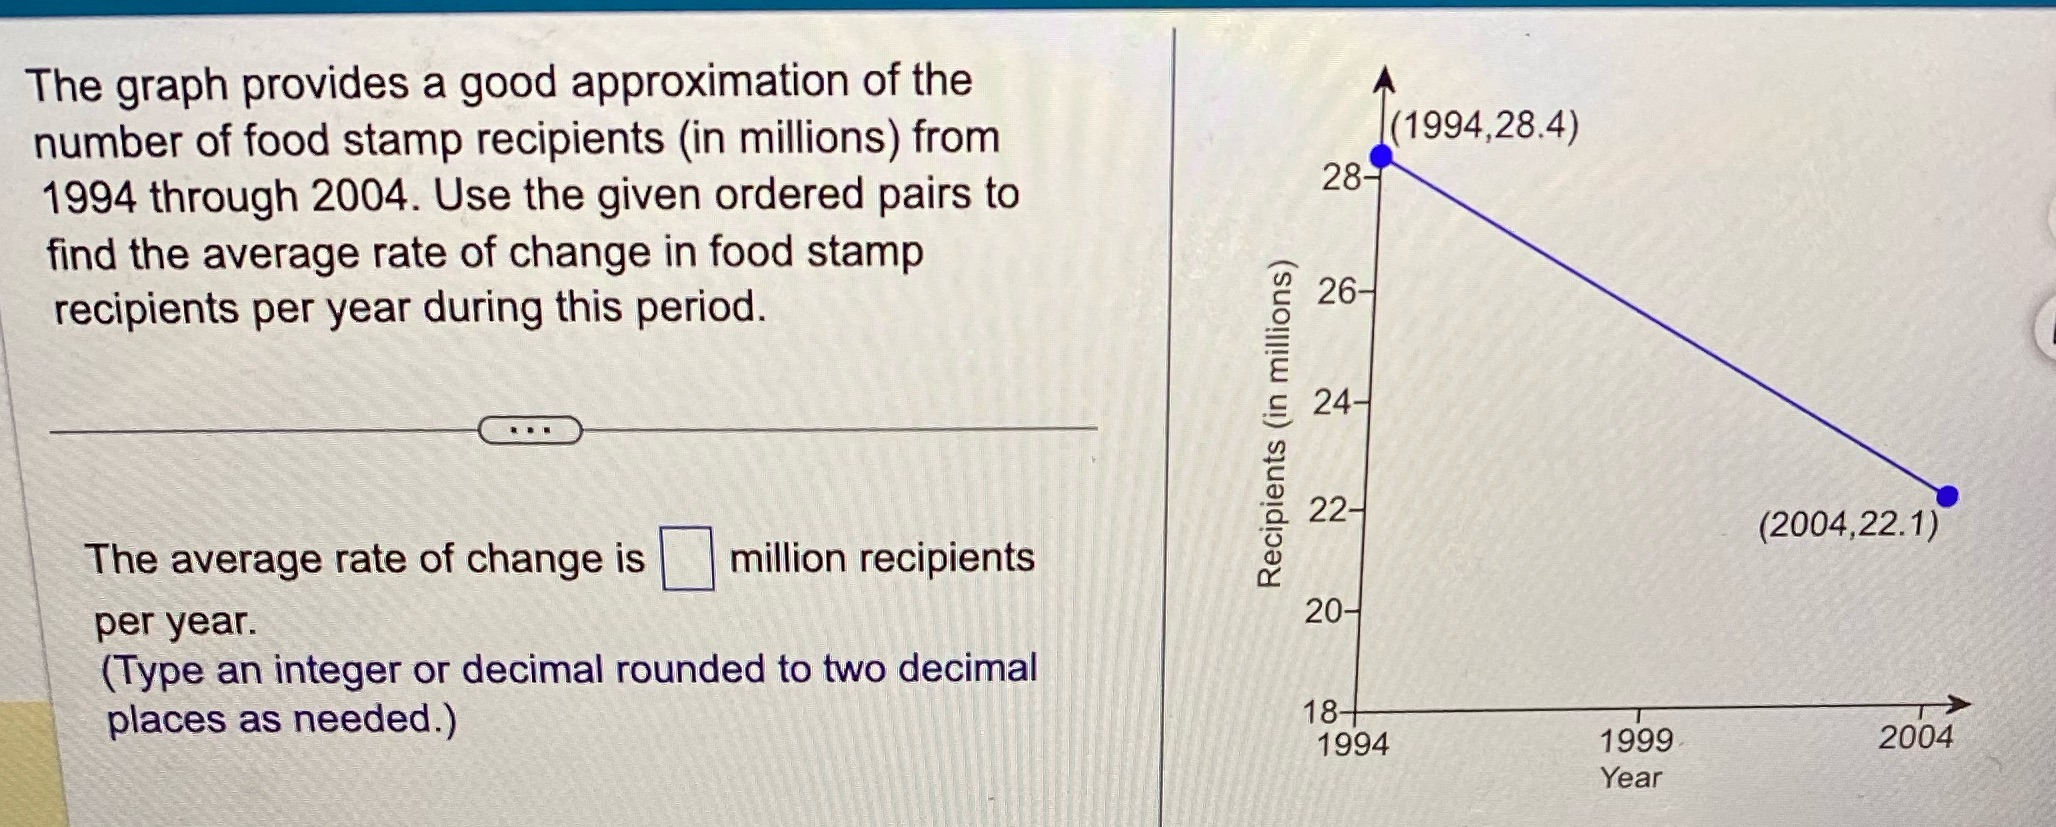
Question: I need some help, thank you! The graph provides a good approximation of the number of food stamp recipients (in millions) from (1994 ,28.4 )

I need some help, thank you!

I need some help, thank you! The graph provides a
The graph provides a good approximation of the number of food stamp recipients (in millions) from (1994 ,28.4 ) 1994 through 2004. Use the given ordered pairs to 28- find the average rate of change in food stamp recipients per year during this period. 26- 24- Recipients (in millions) 22- (2004,22.1) The average rate of change is million recipients per year. 20- (Type an integer or decimal rounded to two decimal places as needed.) 18- 1994 1999 2004 Year

Step by Step Solution

There are 3 Steps involved in it

1 Expert Approved Answer
Step: 1 Unlock blur-text-image
Question Has Been Solved by an Expert!

Get step-by-step solutions from verified subject matter experts

Step: 2 Unlock
Step: 3 Unlock

Students Have Also Explored These Related Mathematics Questions!