

Question: CIS 115 C++ Programming Help Please. How does the asterisk output on increasing numbers like the Expected output? The Actual output is what I have
CIS 115 C++ Programming
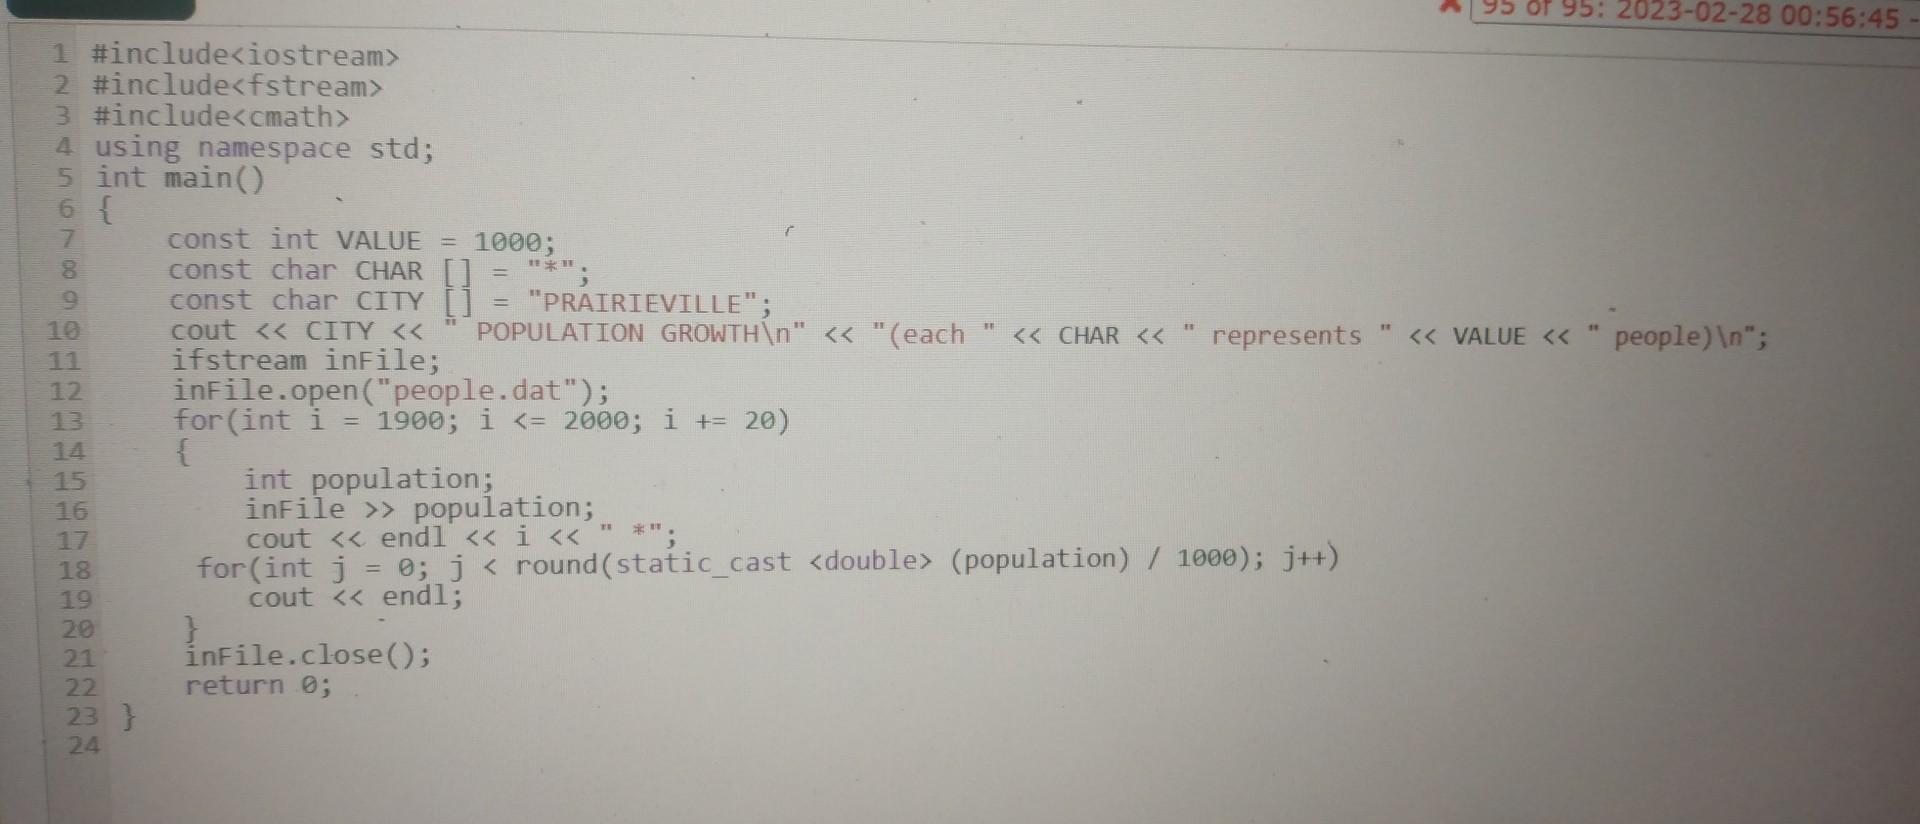
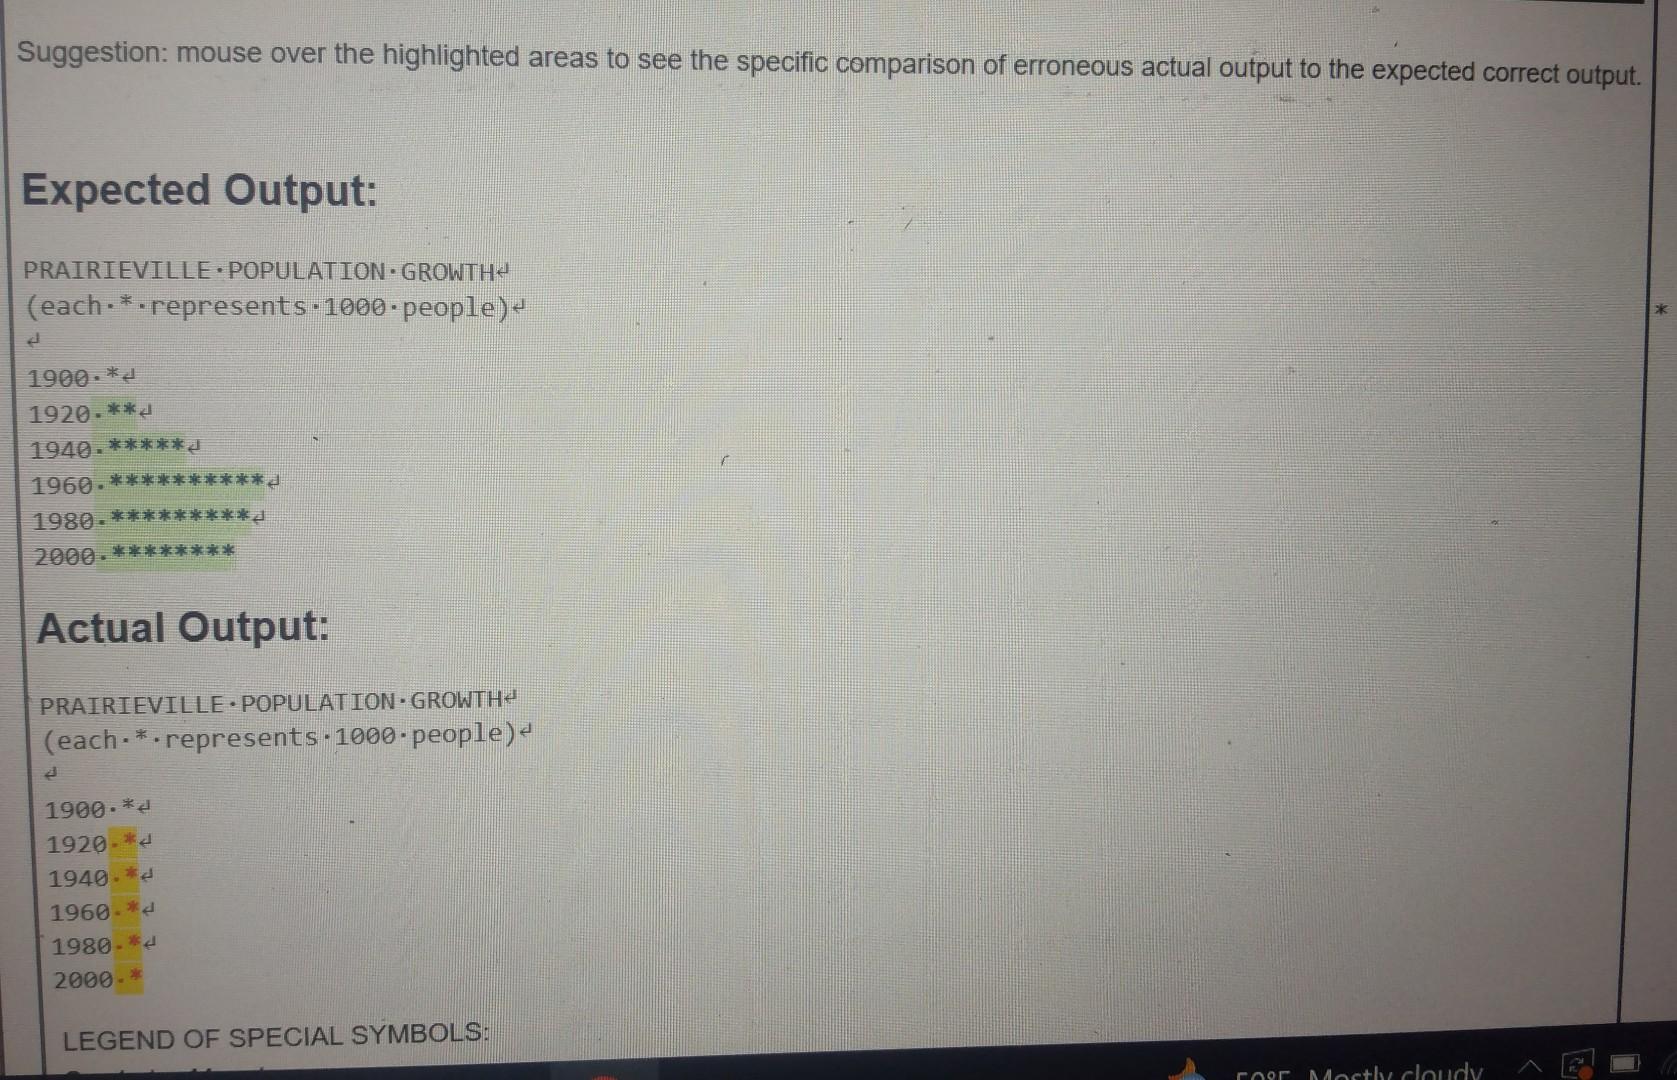
Help Please. How does the asterisk output on increasing numbers like the Expected output? The Actual output is what I have programmed. Please help. Thank you.
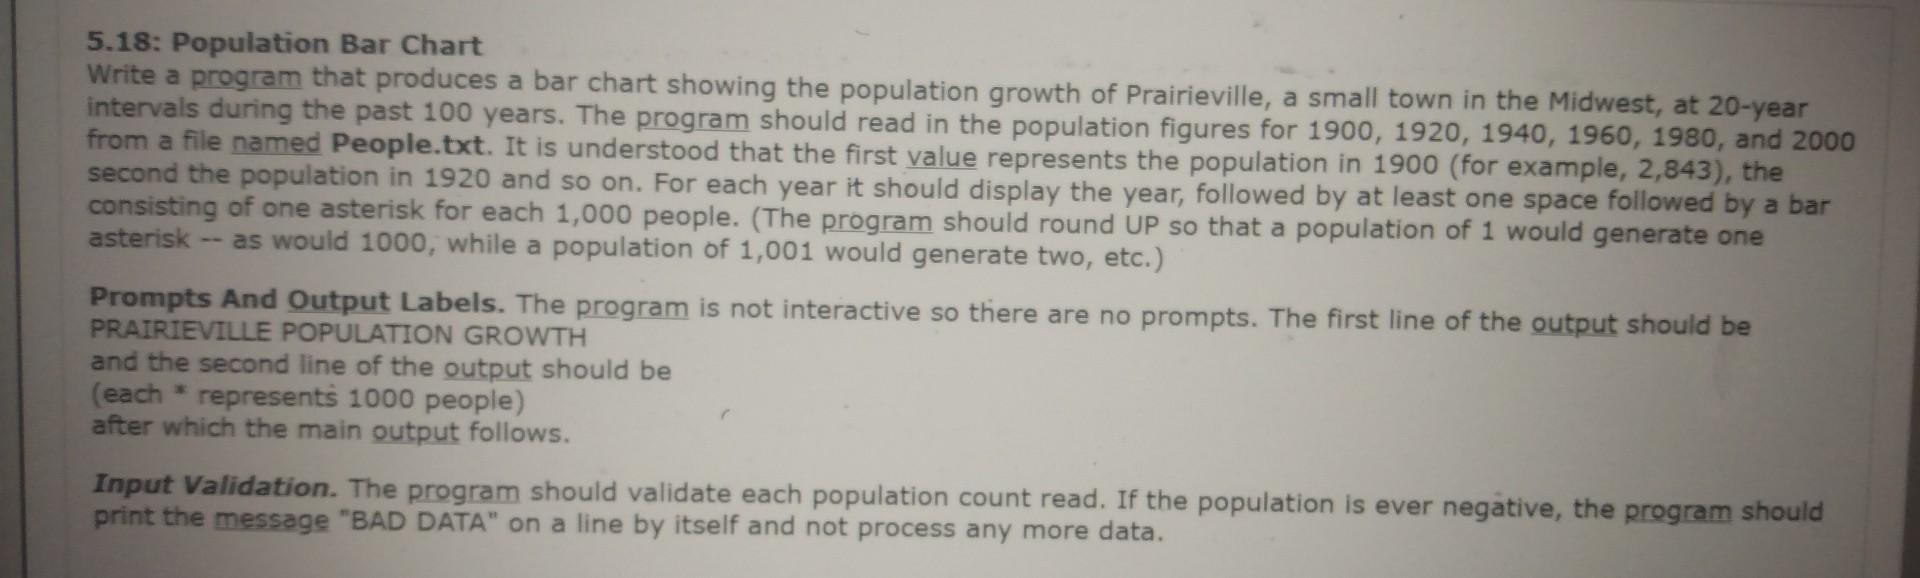
5.18: Population Bar Chart Write a program that produces a bar chart showing the population growth of Prairieville, a small town in the Midwest, at 20 -year intervals during the past 100 years. The program should read in the population figures for 1900,1920,1940,1960,1980, and 2000 from a file named People.txt. It is understood that the first value represents the population in 1900 (for example, 2,843), the second the population in 1920 and so on. For each year it should display the year, followed by at least one space followed by a bar consisting of one asterisk for each 1,000 people. (The program should round UP so that a population of 1 would generate one asterisk - as would 1000, while a population of 1,001 would generate two, etc.) Prompts And Output Labels. The program is not interactive so there are no prompts. The first line of the output should be PRAIRIEVILLE POPULATION GROWTH and the second line of the output should be (each represents 1000 people) after which the main output follows. Input Validation. The program should validate each population count read. If the population is ever negative, the program should print the message "BAD DATA" on a line by itself and not process any more data. Suggestion: mouse over the highlighted areas to see the specific comparison of erroneous actual output to the expected correct output. Expected Output: PRAIRIEVILLE PPOPULATION GROWTH (each.*.represents 1000 people) 1900. 1920. 1940. 1960. 1980. 2000. Actual Output: PRAIRIEVILLE POPULATION - GROWTH (each.* represents 1000 people) 1900 19204 19604 19604 19804 2000 LEGEND OF SPECIAL SYMBOLS
Step by Step Solution
There are 3 Steps involved in it

Get step-by-step solutions from verified subject matter experts