

Question: CL = confidence level Grubbs table at 95 % CL: n =6 Gtable value = 1.822 n = 7 Gtable value = 1.938 n =
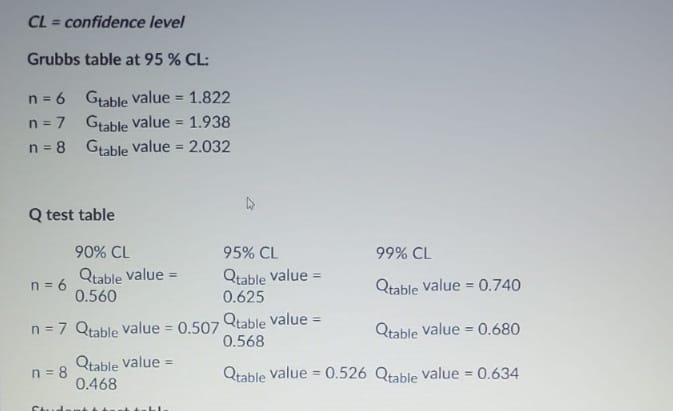
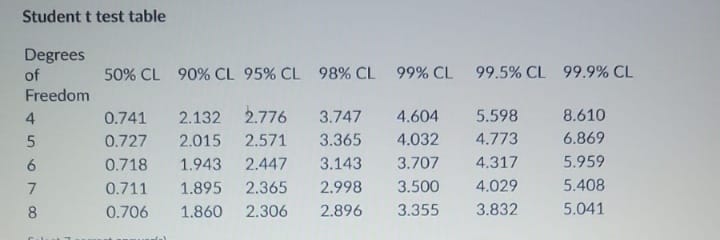
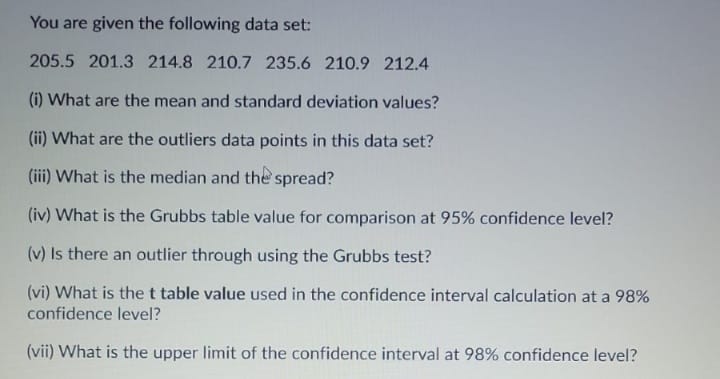
CL = confidence level Grubbs table at 95 % CL: n =6 Gtable value = 1.822 n = 7 Gtable value = 1.938 n = 8 Gtable Value = 2.032 Q test table 90% CL 95% CL 99% CL n = 6 Qtable value = Qtable value = 0.560 0.625 Qtable value = 0.740 n =7 Qtable value = 0.507 Qtable value = 0.568 Qtable Value = 0.680 n = 8 Qtable value = 0.468 Qtable value = 0.526 Qtable value = 0.634Student t test table Degrees of 50% CL 90% CL 95% CL 98% CL 99% CL 99.5% CL 99.9% CL Freedom 0.741 2.132 2.776 3.747 4.604 5.598 8.610 0.727 2.015 2.571 3.365 4.032 4.773 6.869 0.718 1.943 2.447 3.143 3.707 4.317 5.959 0.711 1.895 2.365 2.998 3.500 4.029 5.408 0.706 1.860 2.306 2.896 3.355 3.832 5.041You are given the following data set: 205.5 201.3 214.8 210.7 235.6 210.9 212.4 (i) What are the mean and standard deviation values? (ii) What are the outliers data points in this data set? (iii) What is the median and the spread? (iv) What is the Grubbs table value for comparison at 95% confidence level? (v) Is there an outlier through using the Grubbs test? (vi) What is the t table value used in the confidence interval calculation at a 98% confidence level? (vii) What is the upper limit of the confidence interval at 98% confidence level
Step by Step Solution
There are 3 Steps involved in it

Get step-by-step solutions from verified subject matter experts