

Question: Class Assignment 5 - Edited Insert Table Chart Text Shape Media Comment 7. The accompanying table, taken from Statistics Canada's National Income Accounts tables, shows
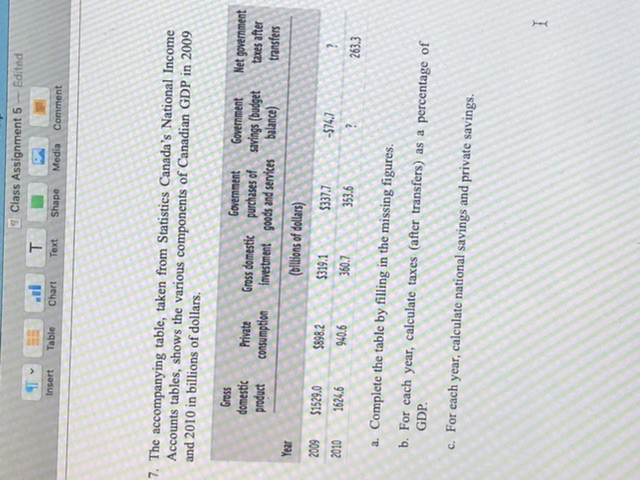
Class Assignment 5 - Edited Insert Table Chart Text Shape Media Comment 7. The accompanying table, taken from Statistics Canada's National Income Accounts tables, shows the various components of Canadian GDP in 2009 and 2010 in billions of dollars. Gross Government Government Net government domestic Private Gross domestic purchases of savings (budget taxes after product consumption investment goods and services balance) transfers Year (billions of dollars) 2009 $1529.0 $898.2 $319.1 $337.7 -$74.7 2010 1624.6 940.6 360.7 353.6 263.3 a. Complete the table by filling in the missing figures. b. For each year, calculate taxes (after transfers) as a percentage of GDP. c. For each year, calculate national savings and private savings
Step by Step Solution
There are 3 Steps involved in it

Get step-by-step solutions from verified subject matter experts