

Question: Class Time Mean St. Dev. n 8:00 AM 24.1 2 13 11:20 AM 23.3 2.1 13 1:30 PM 21.2 2.3 13 5:10 PM 22.8 1.9
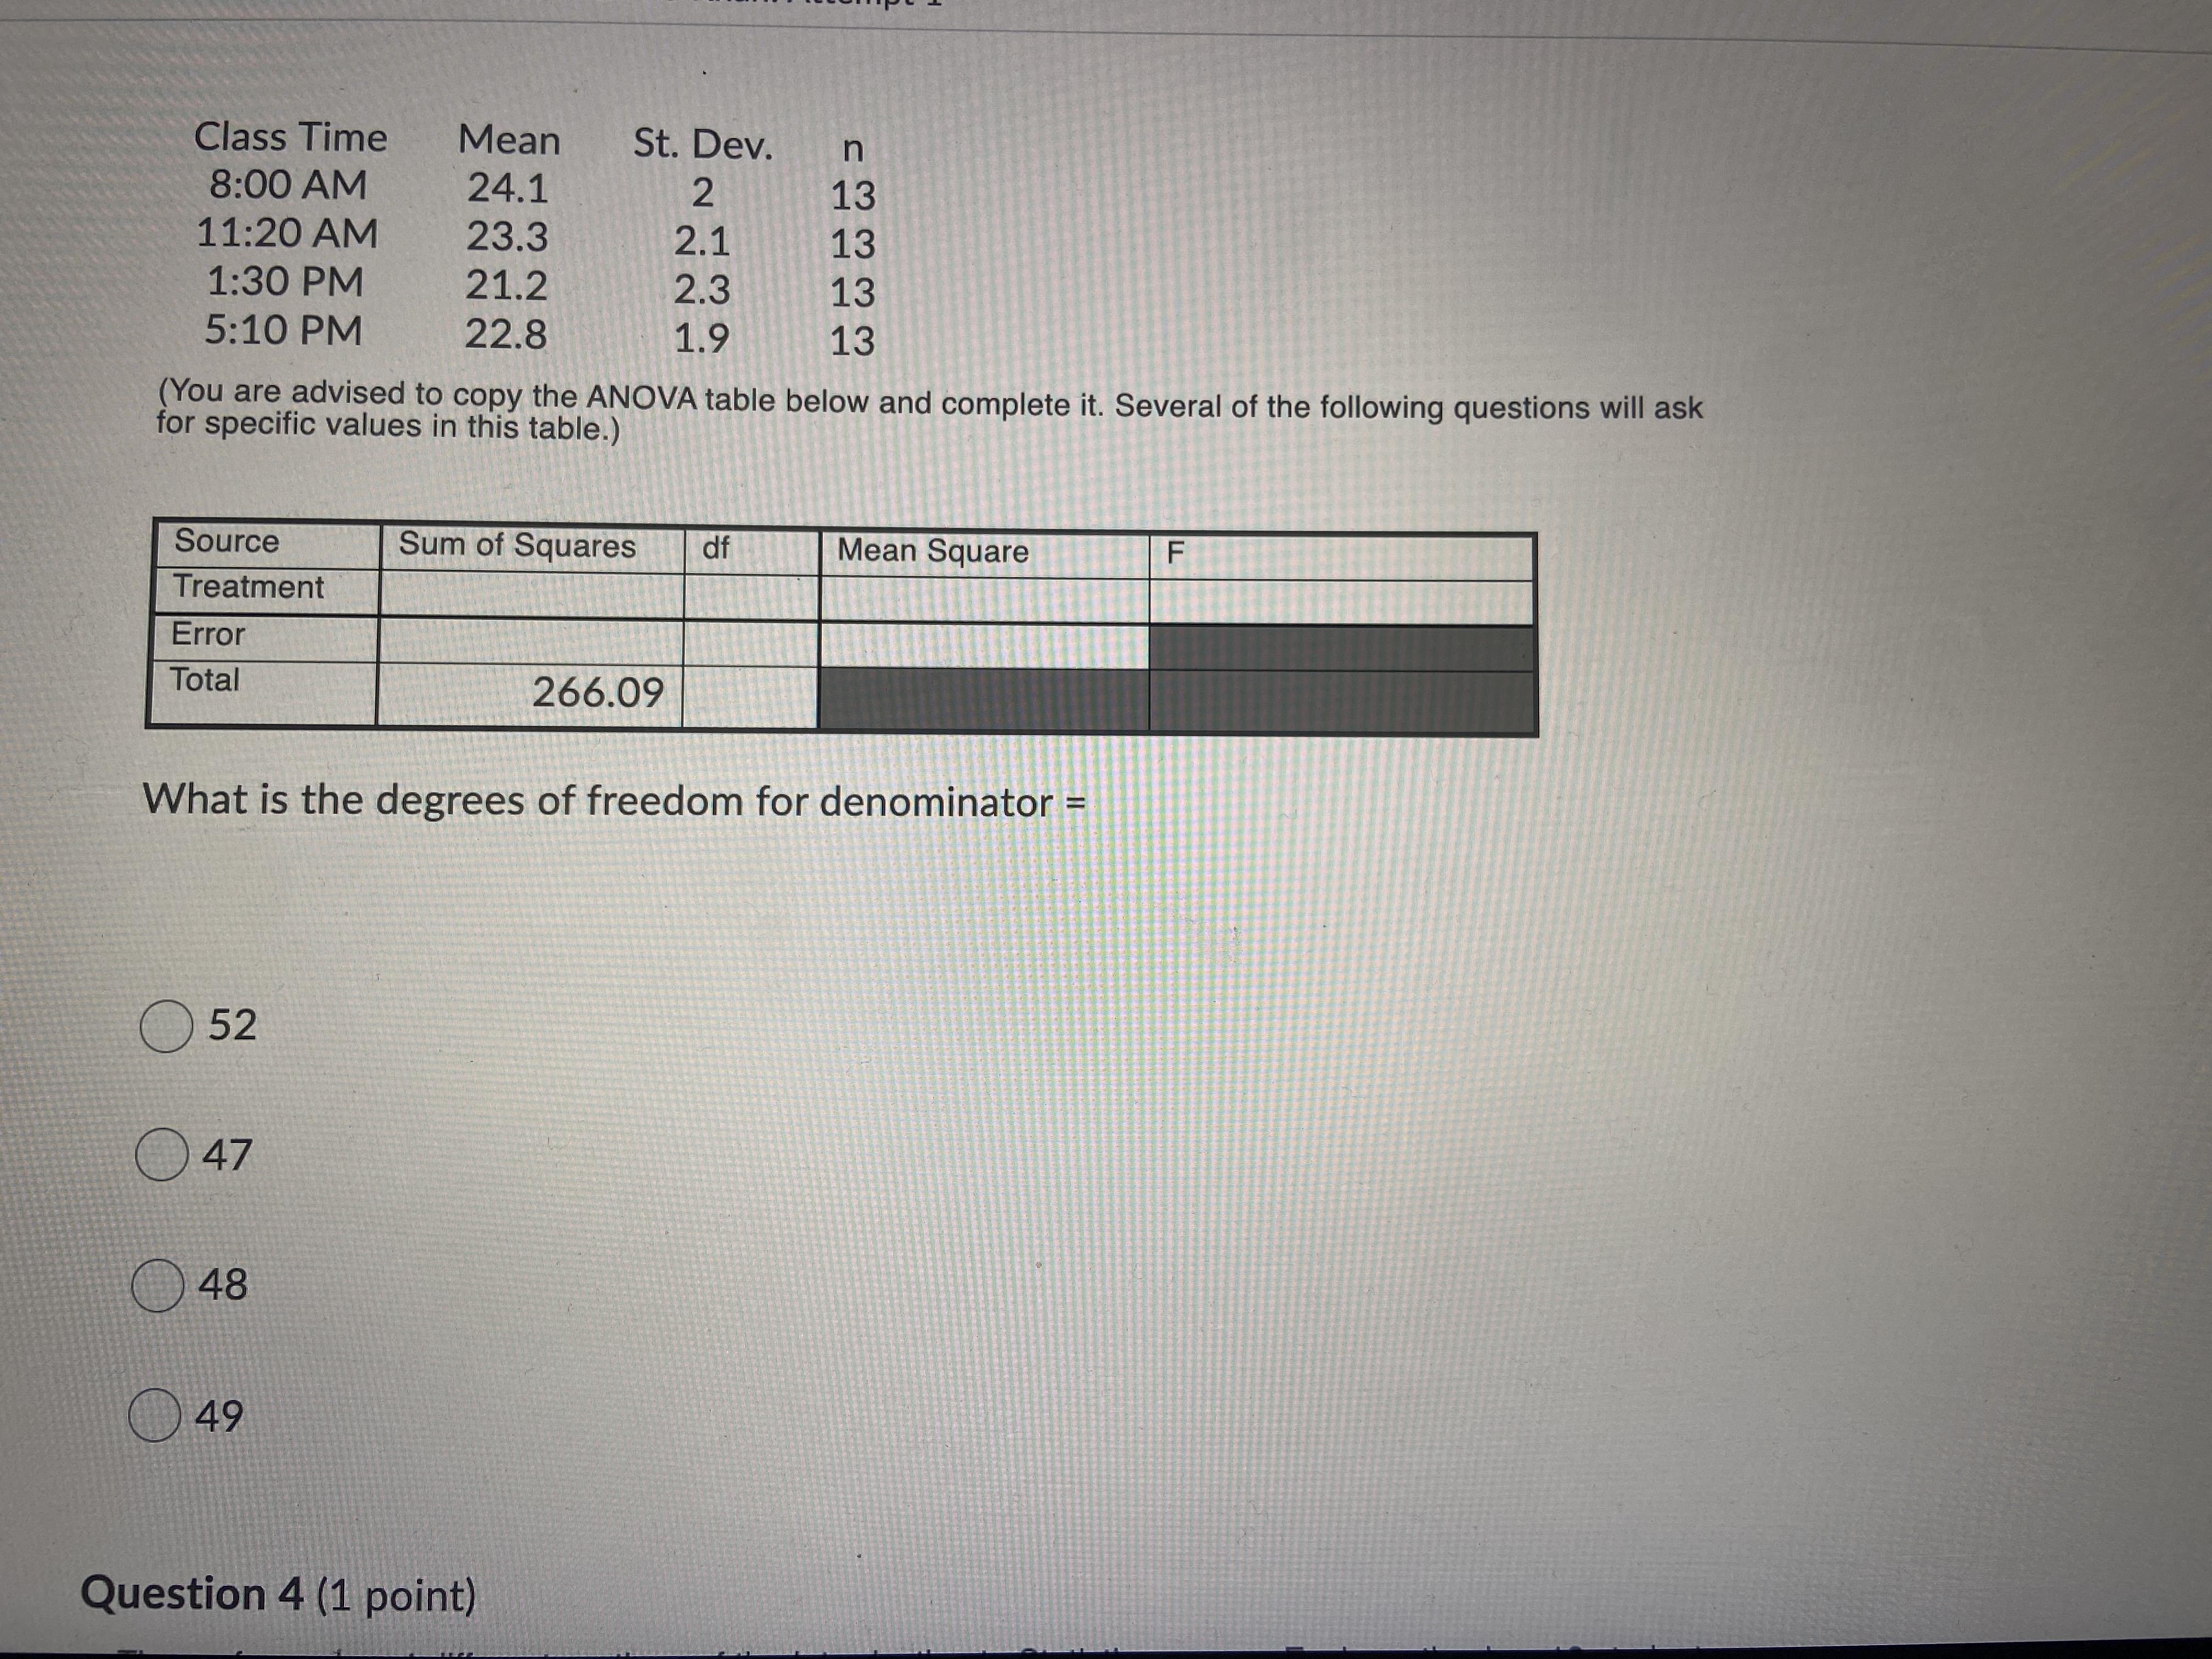
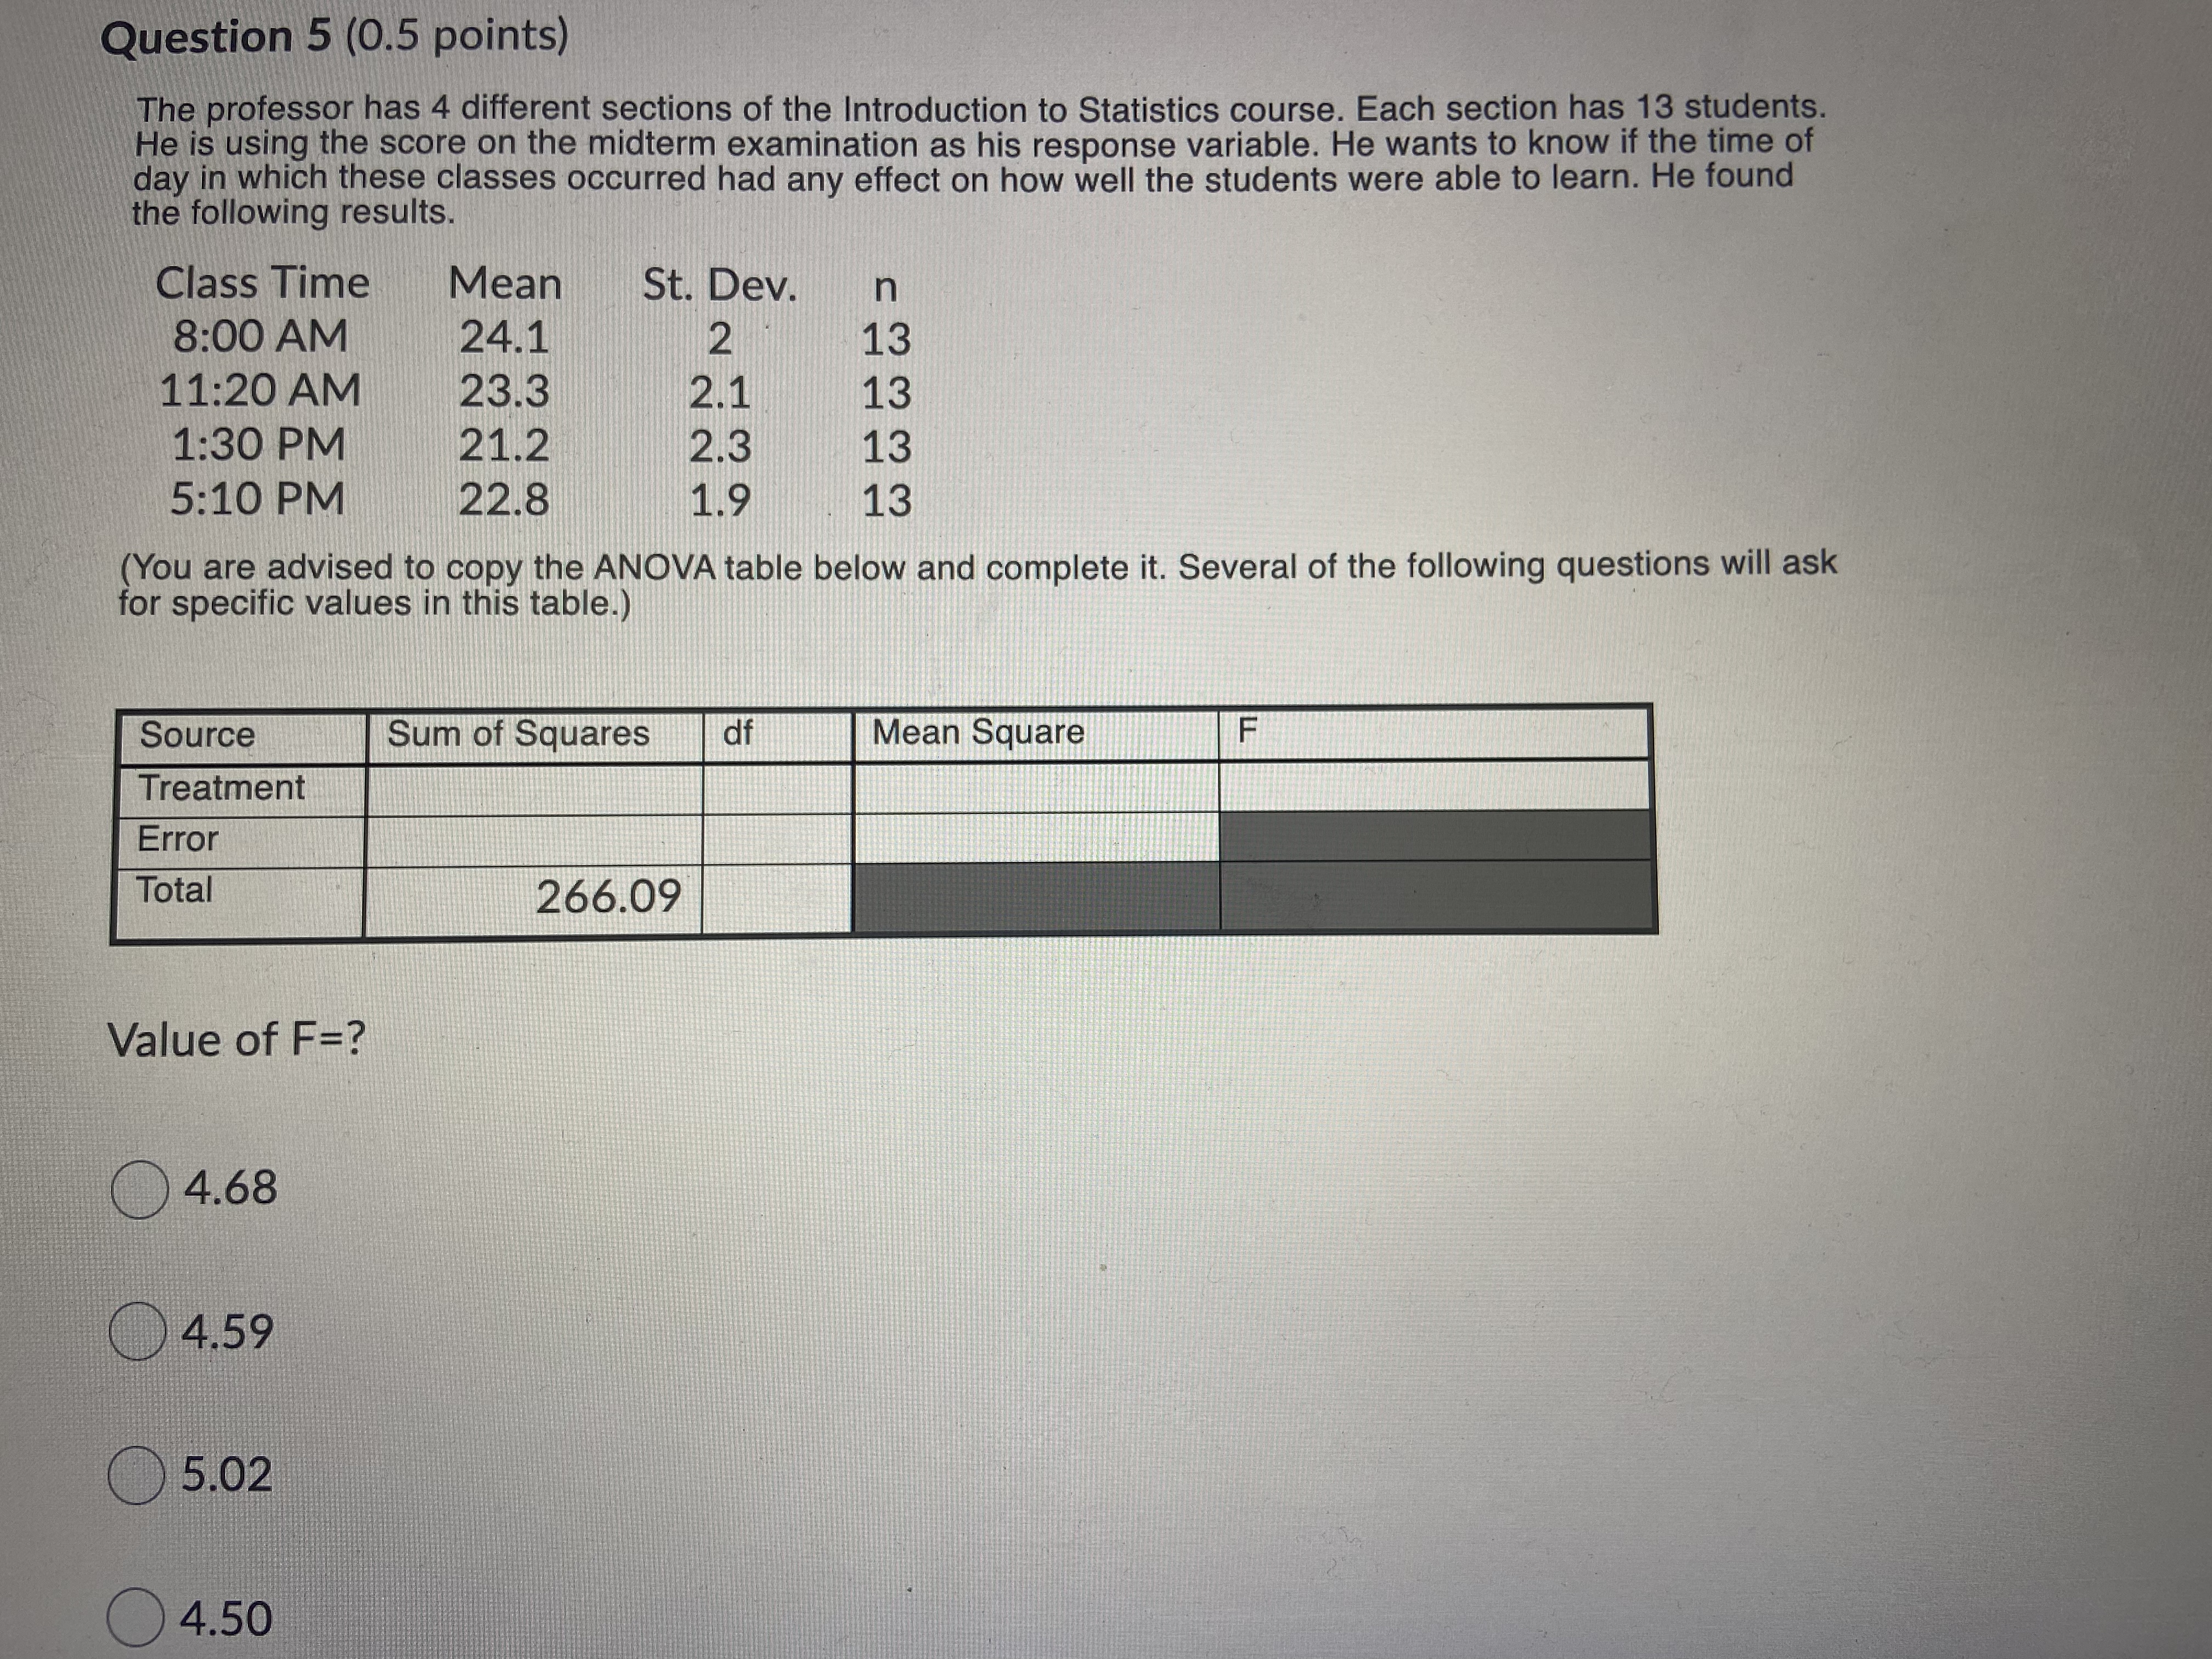
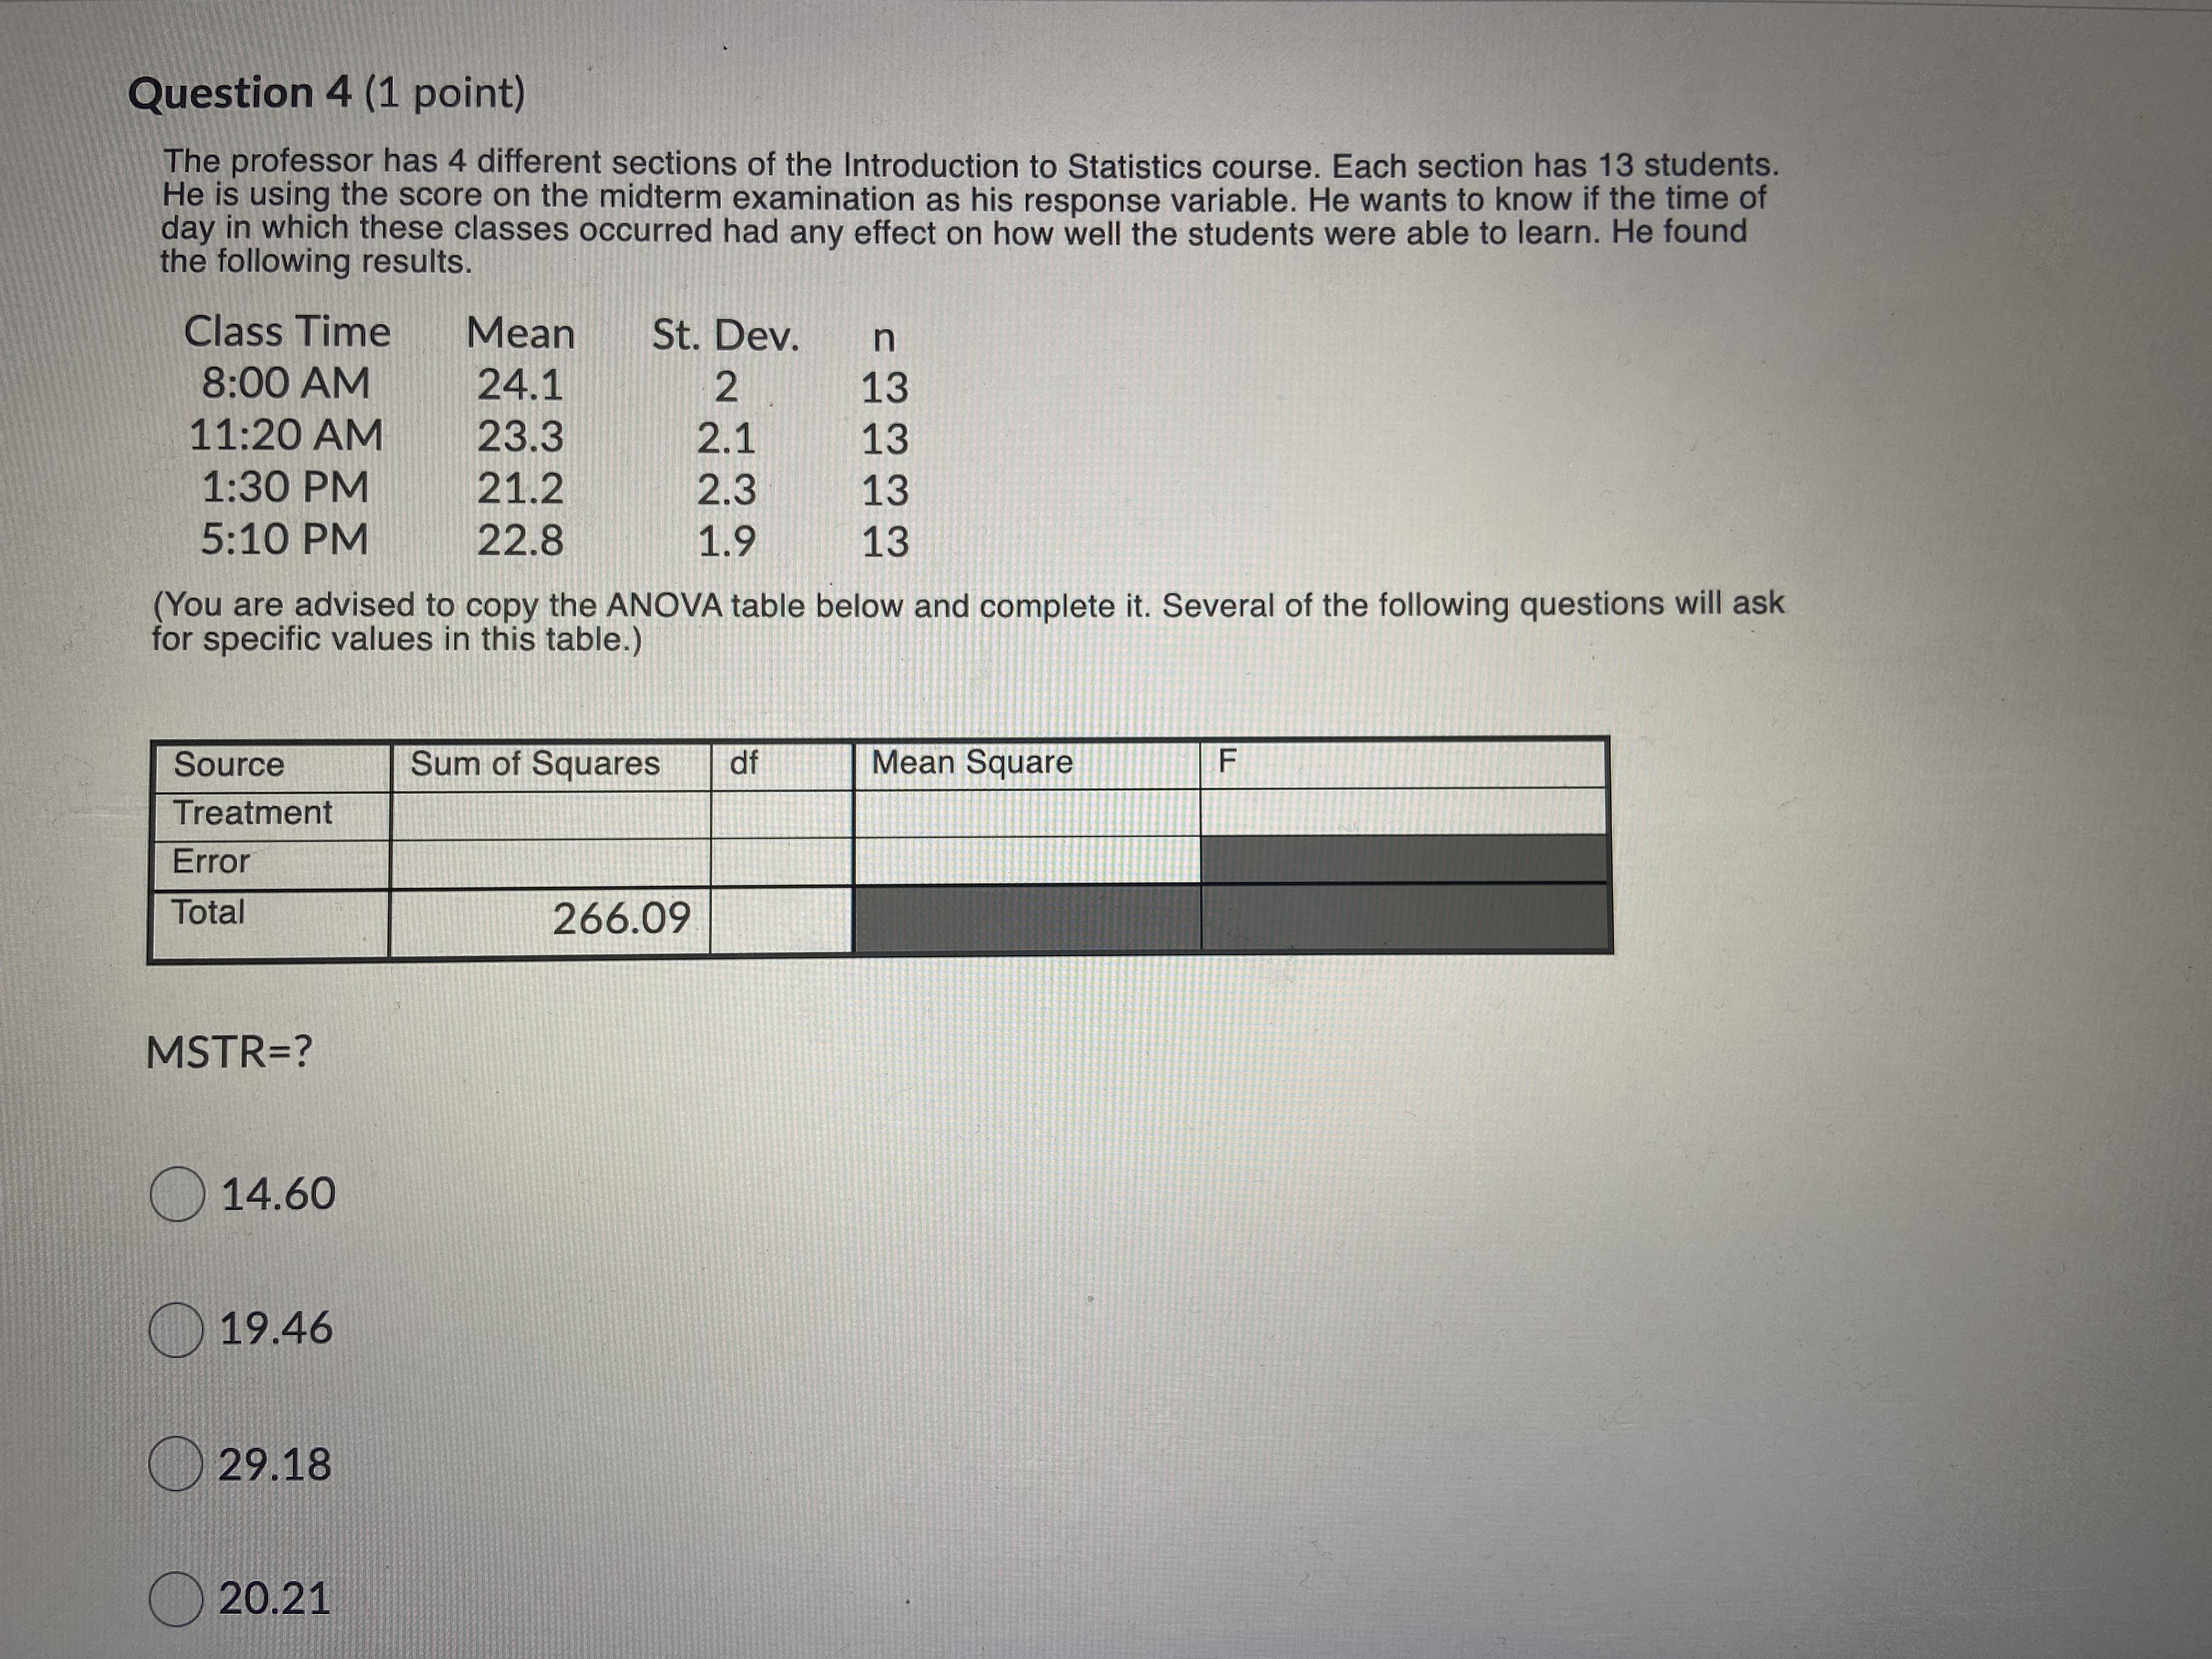
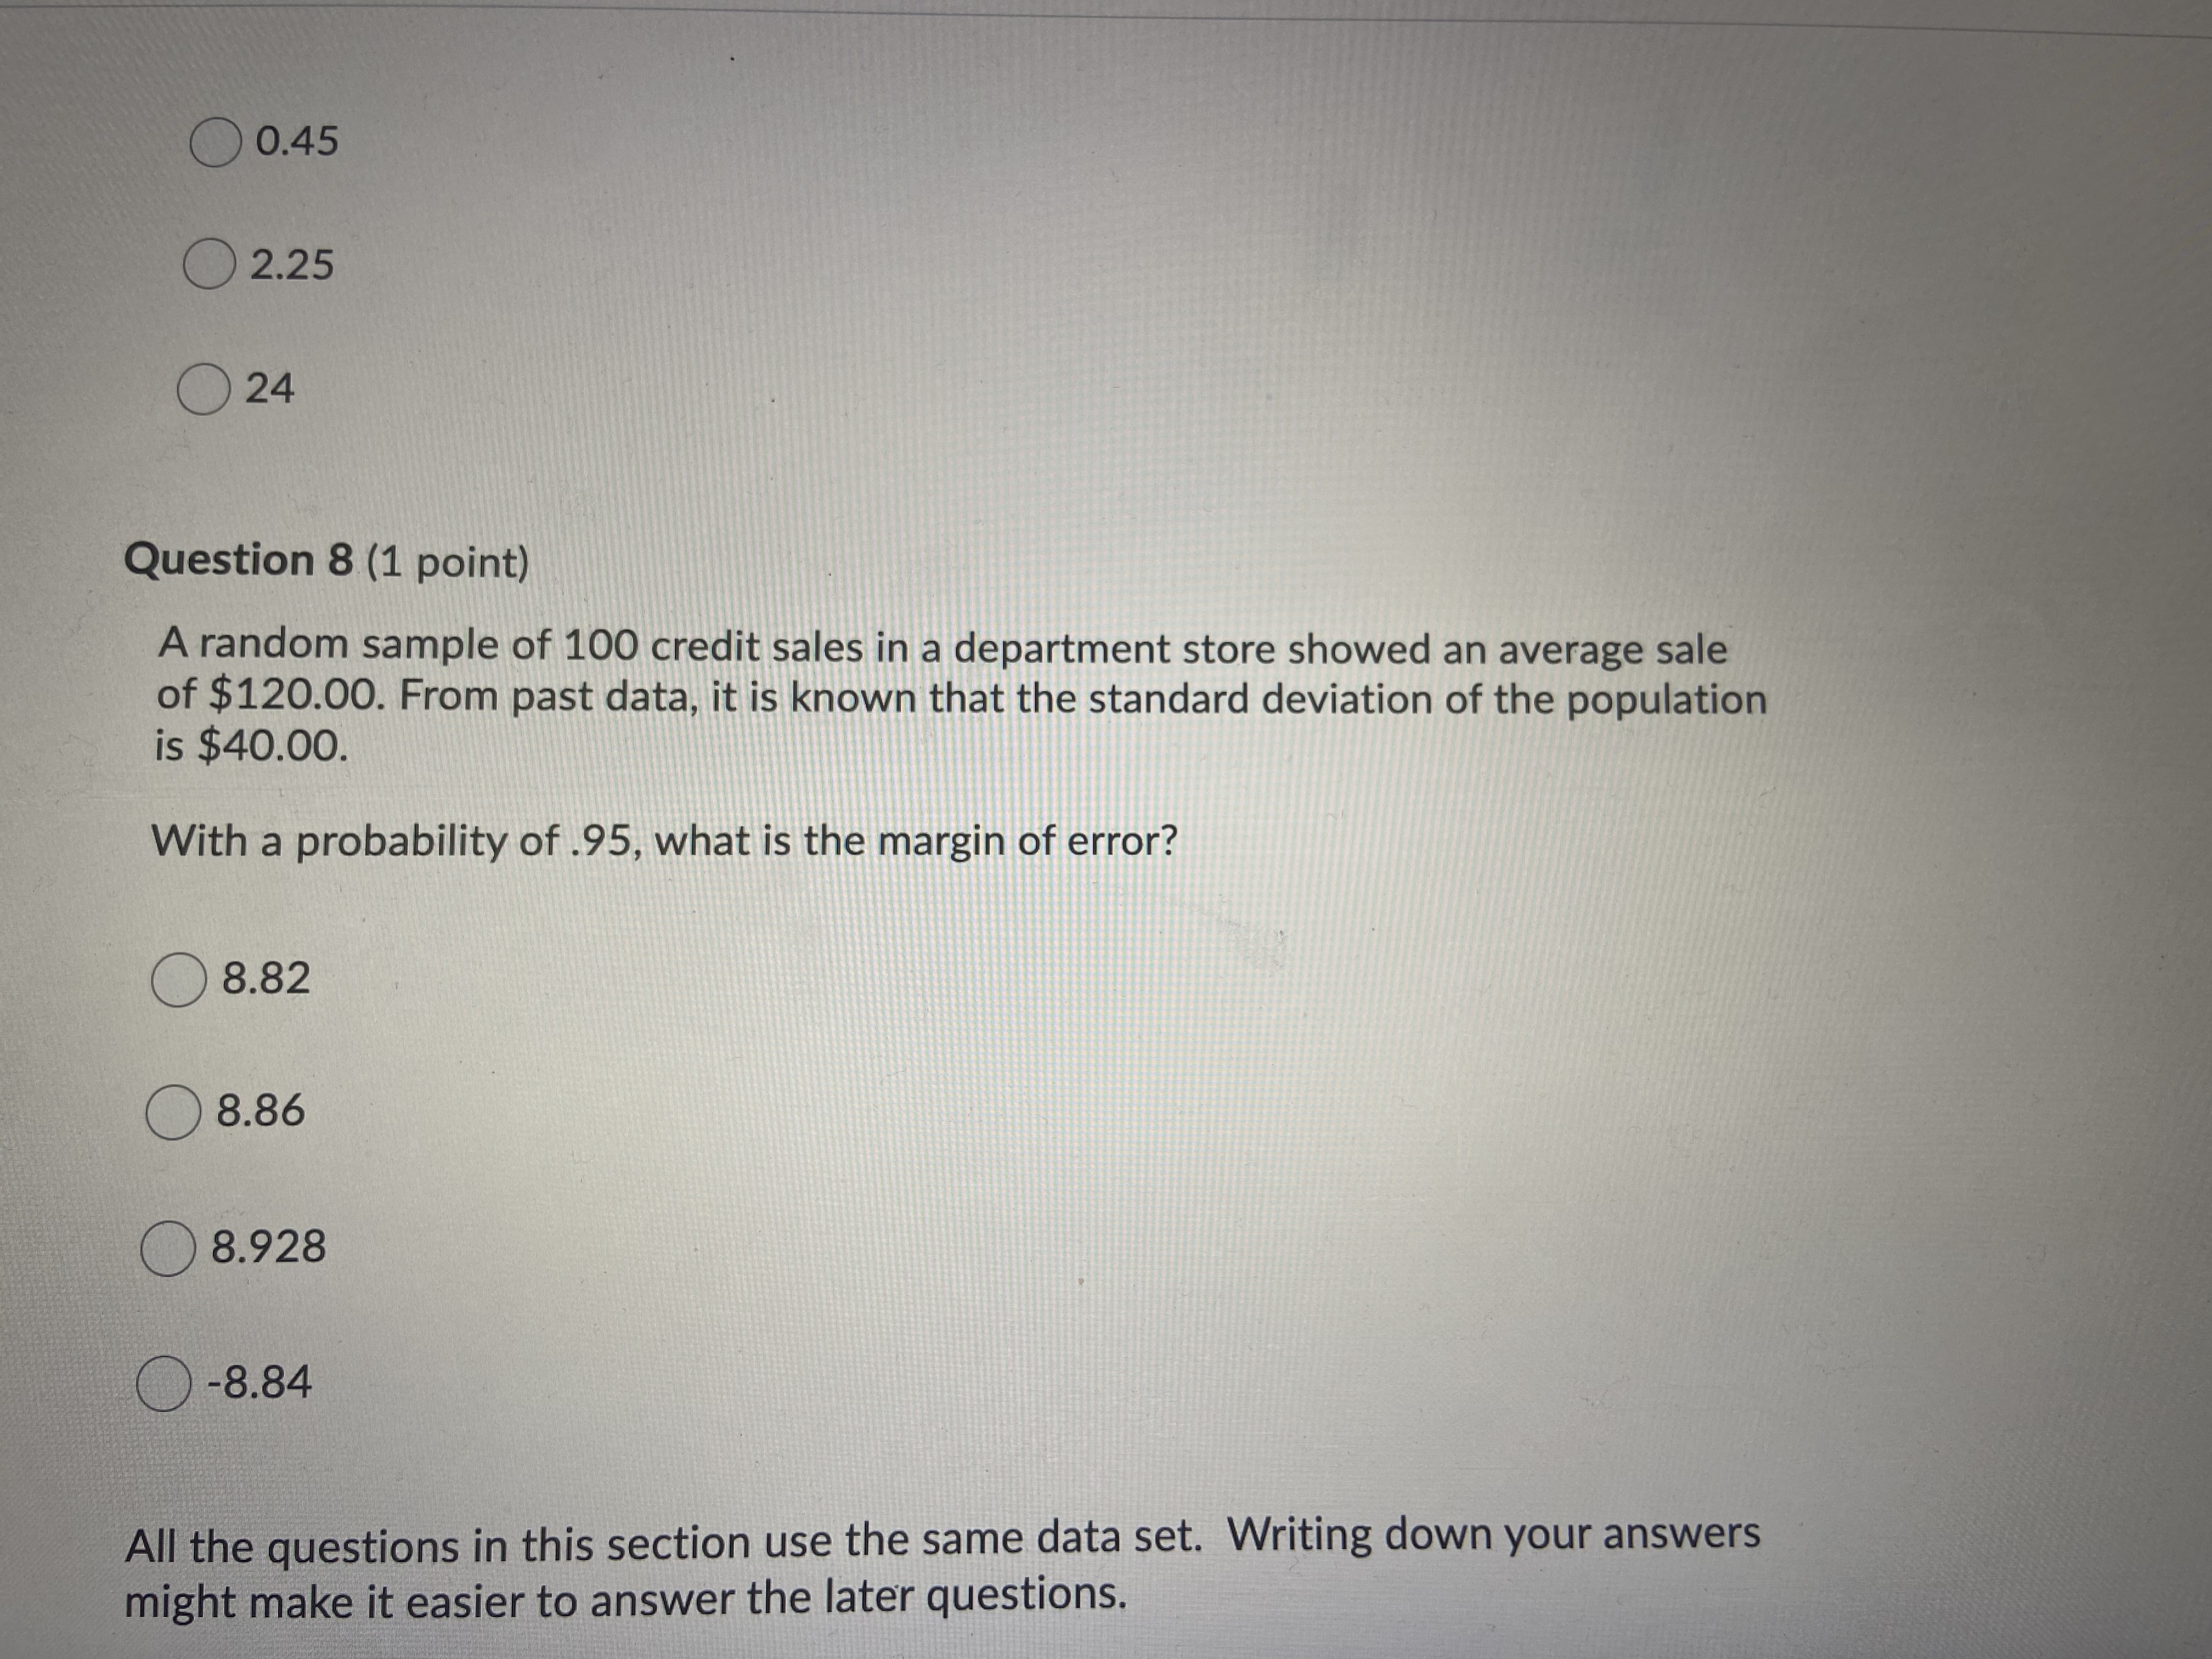
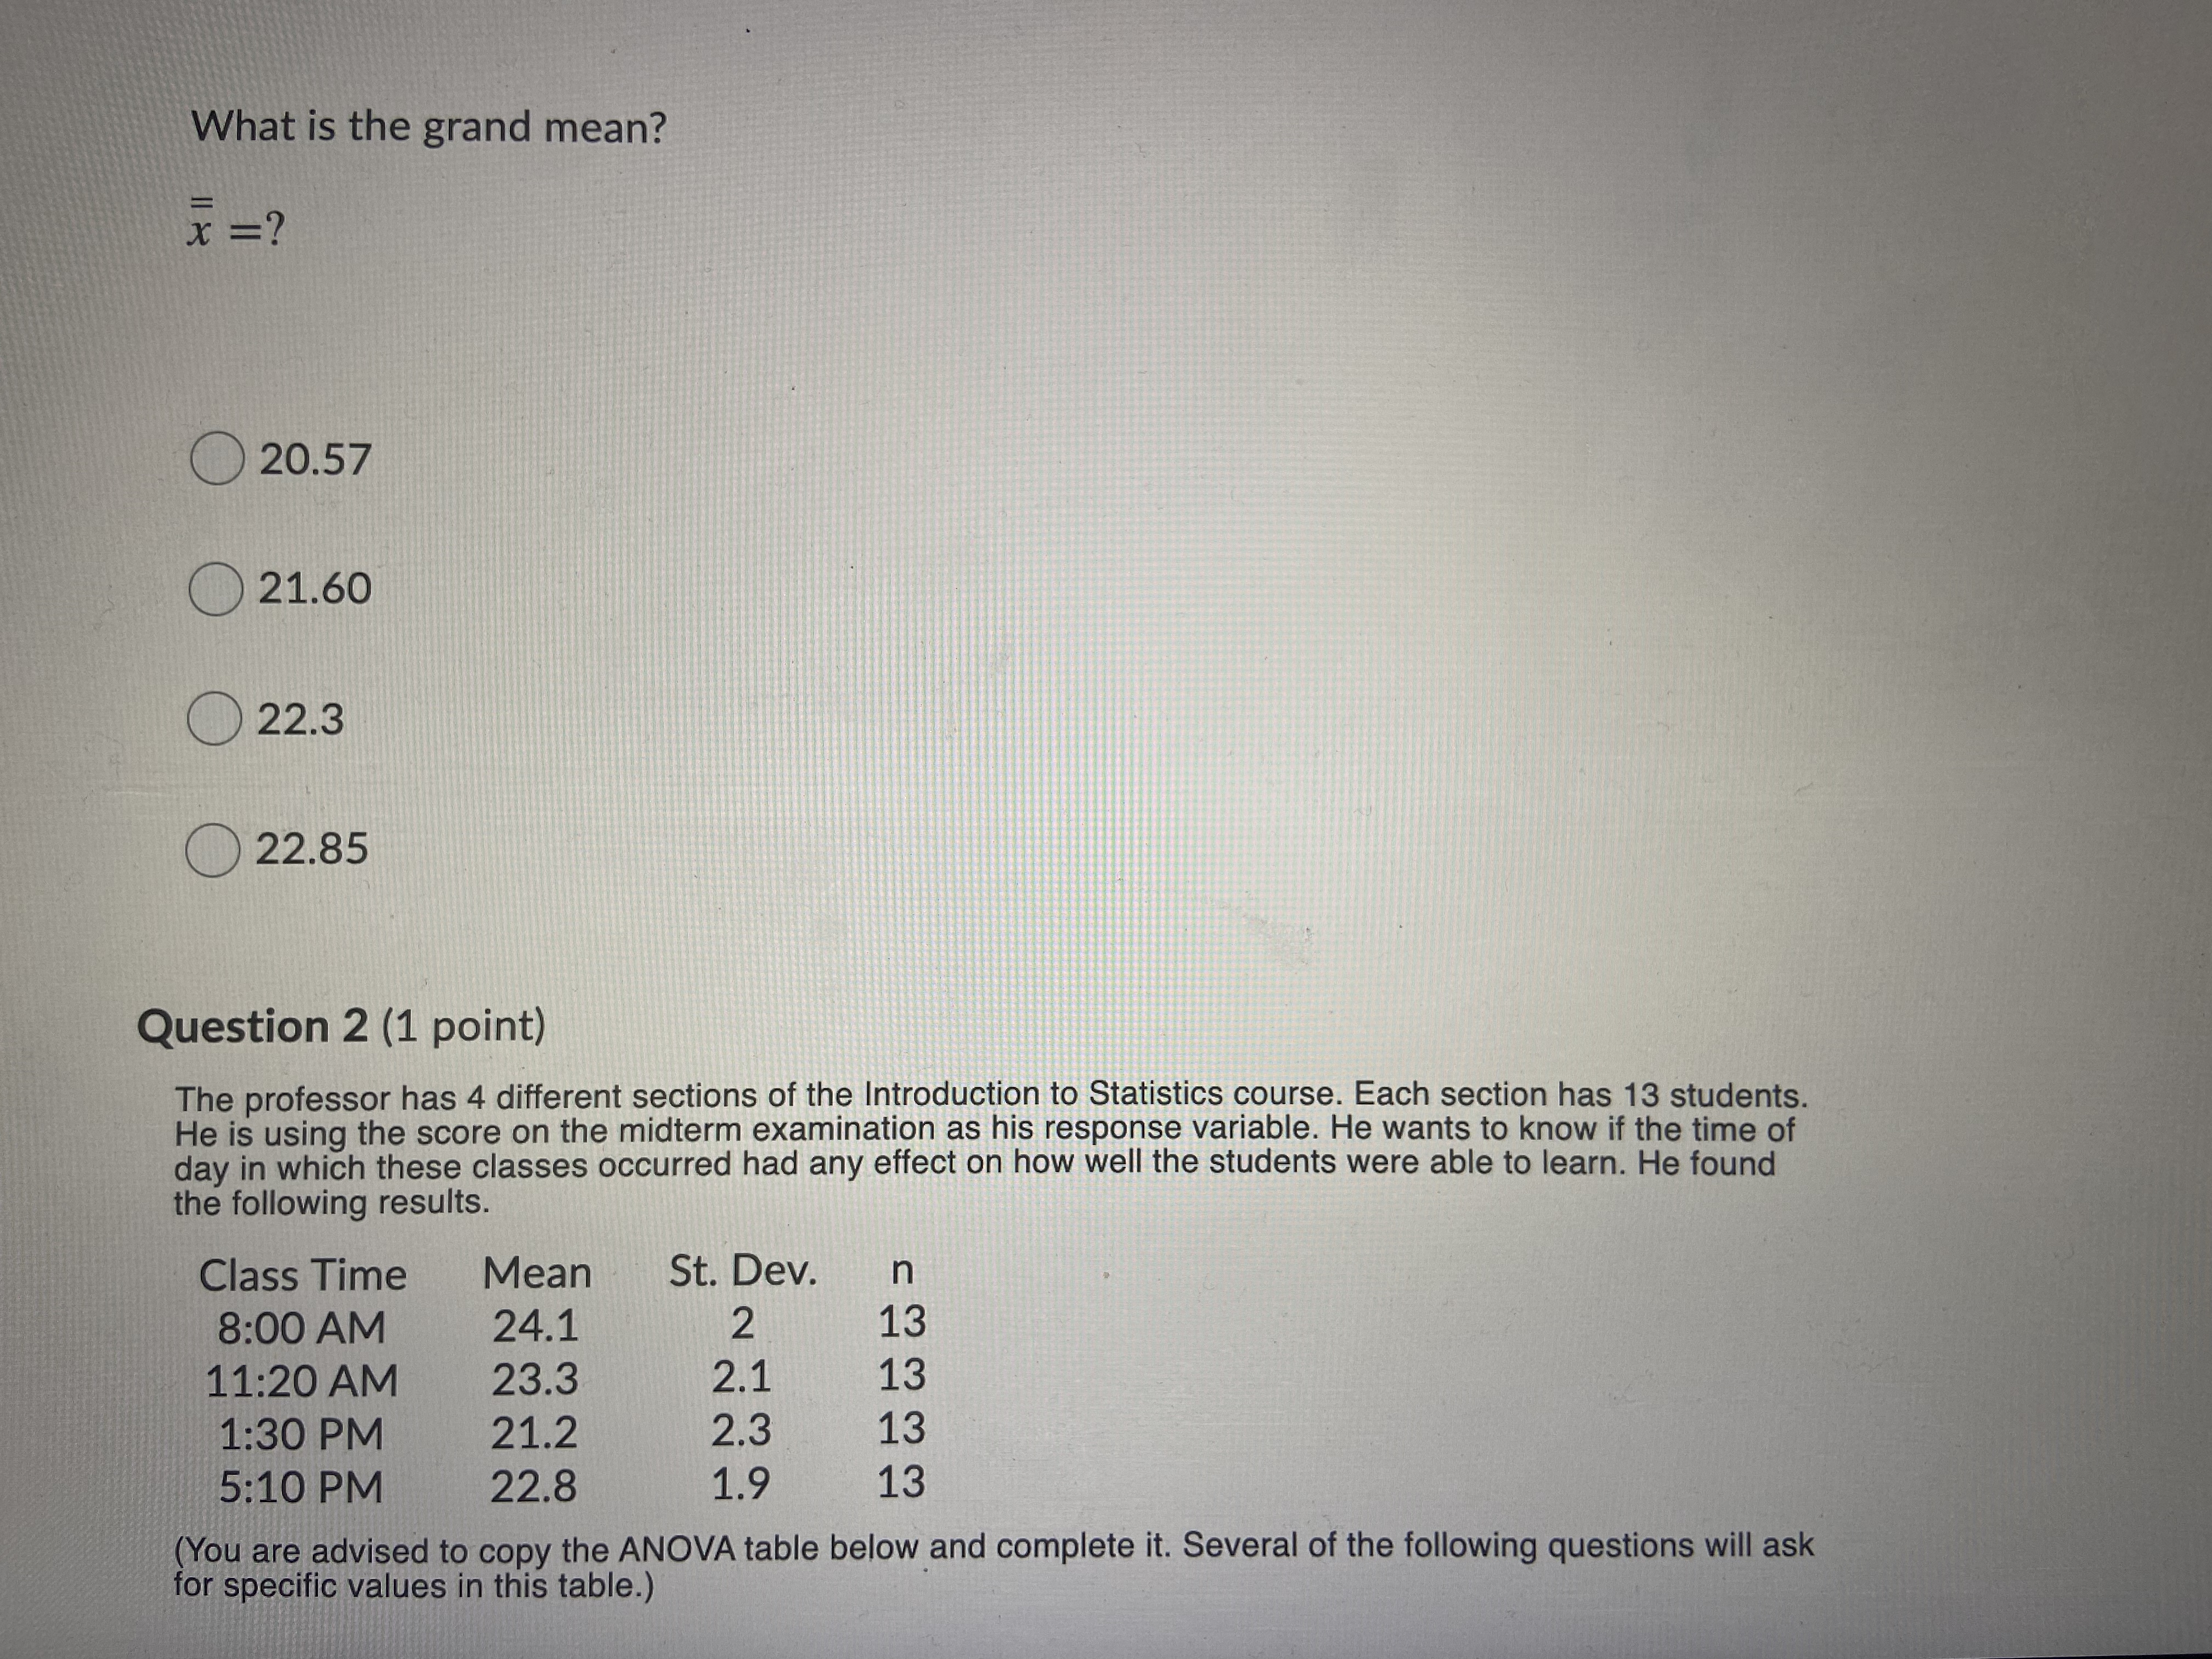
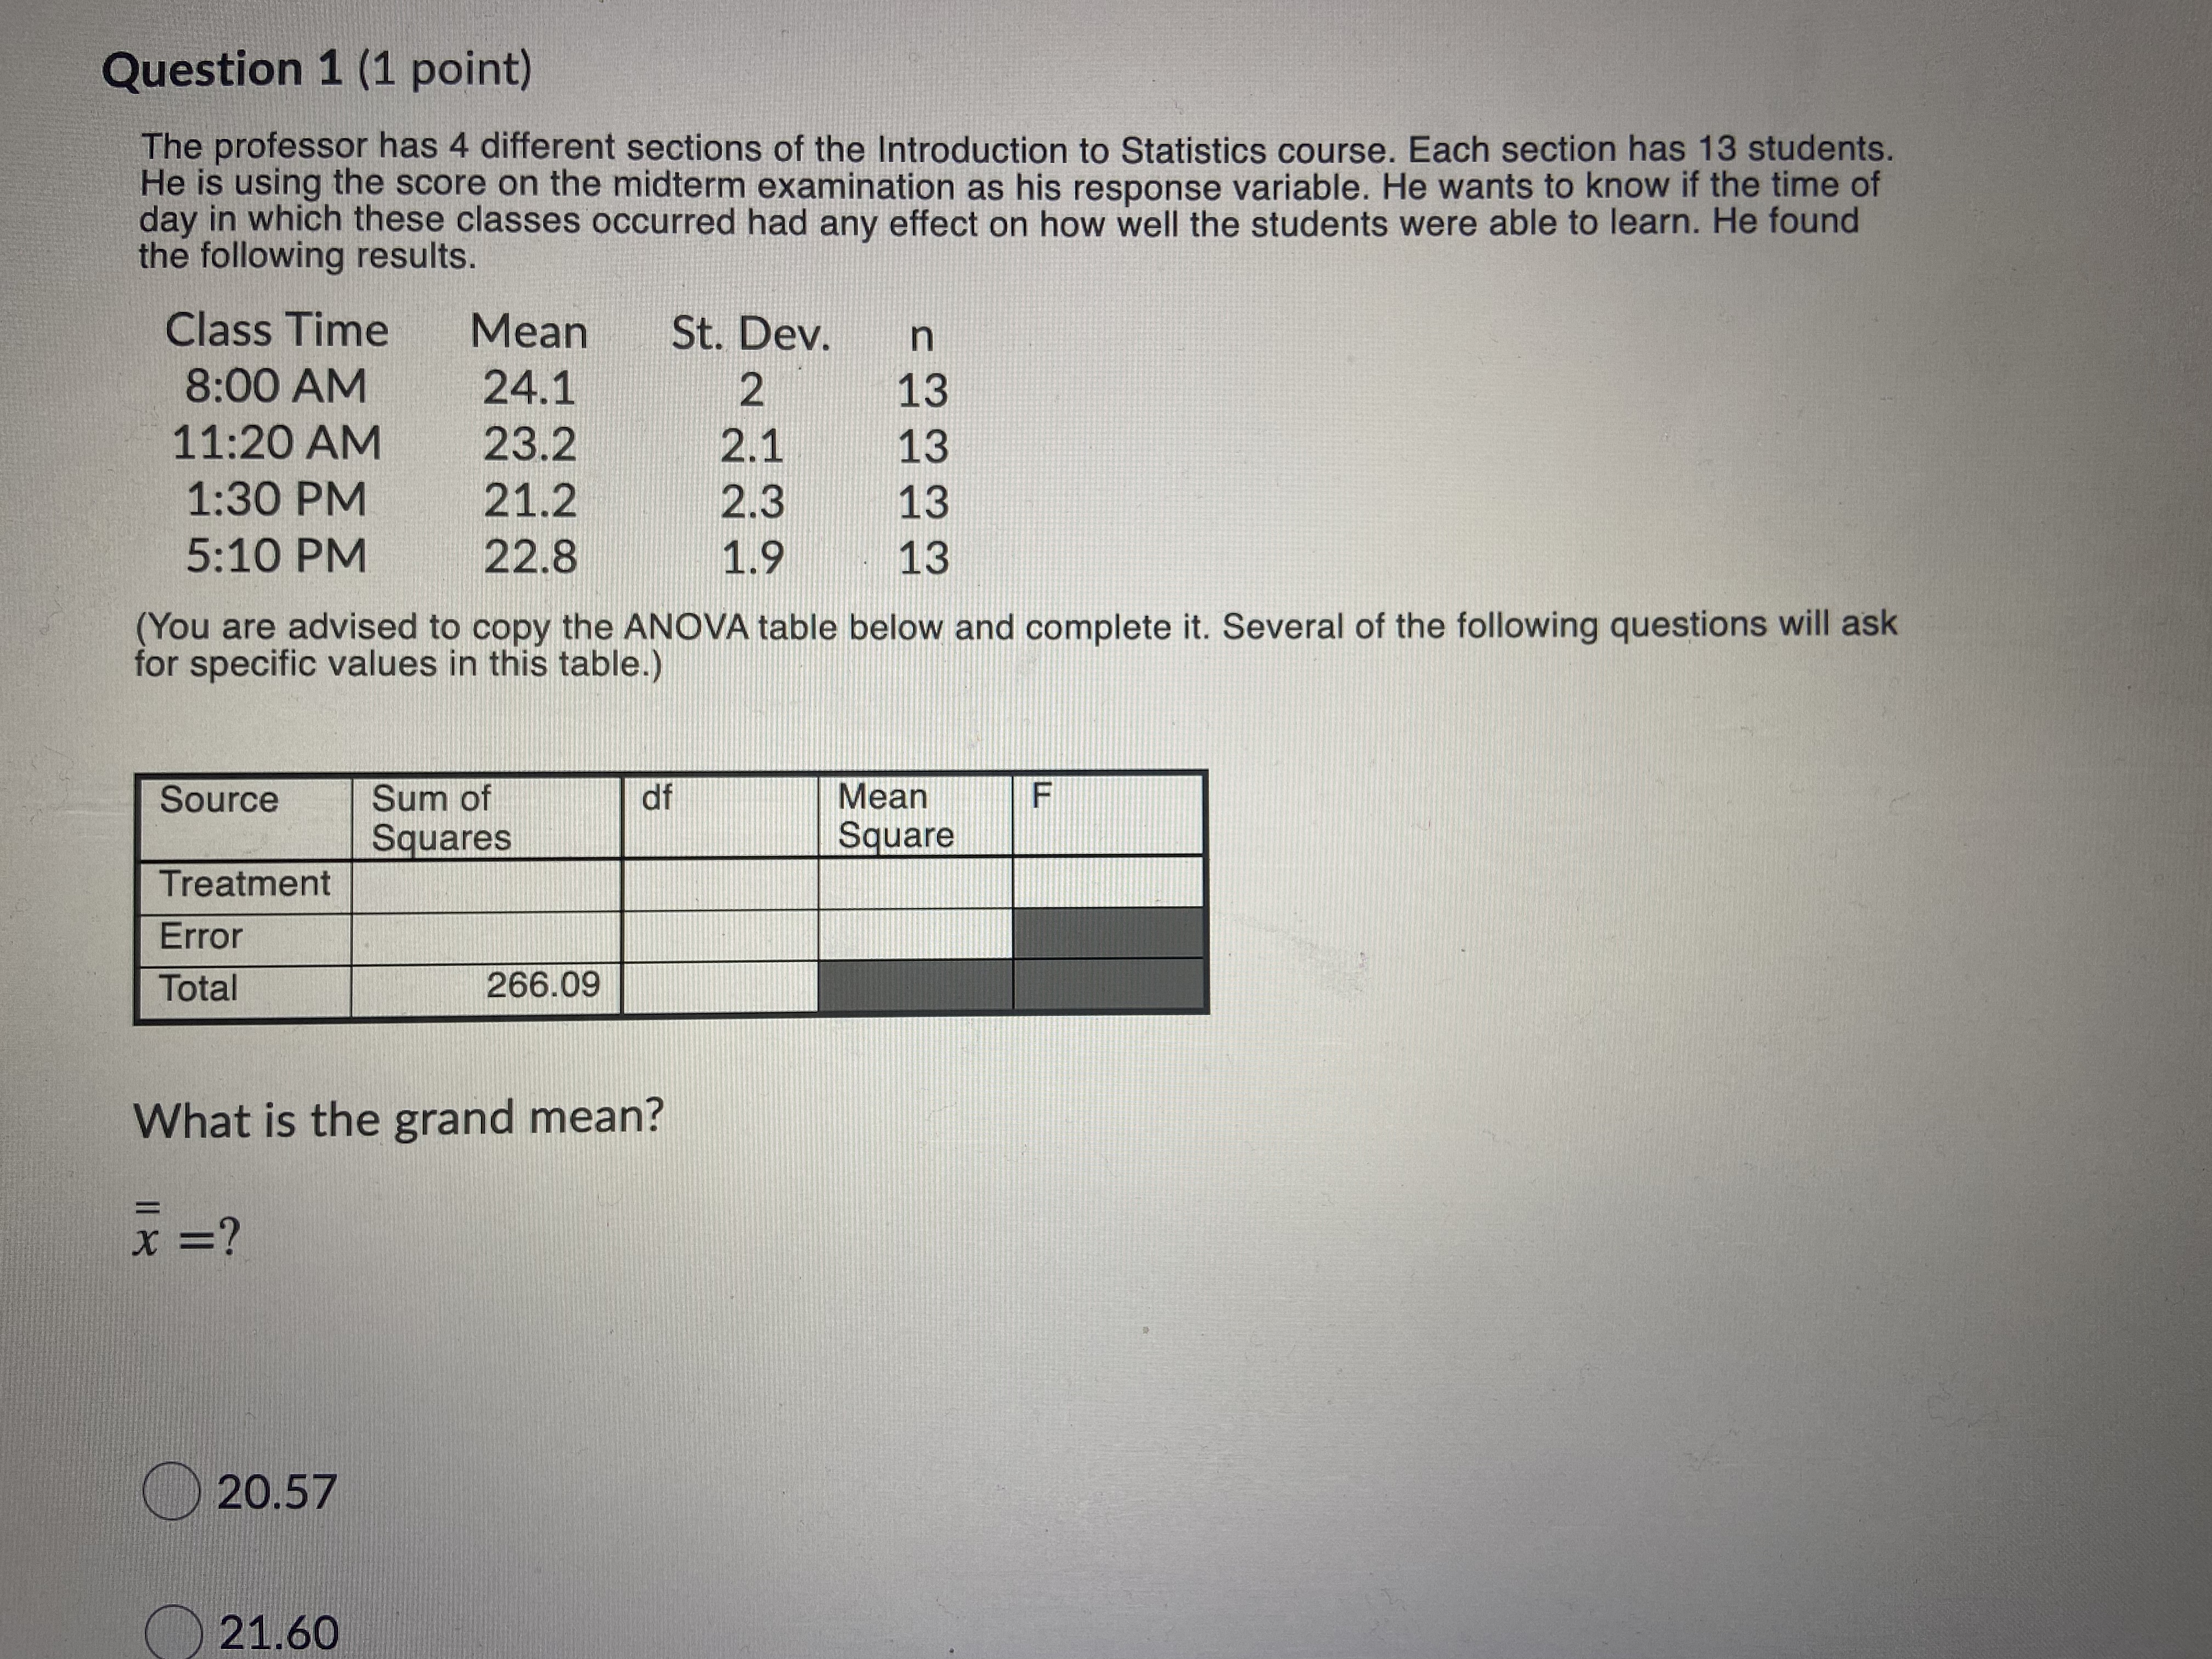
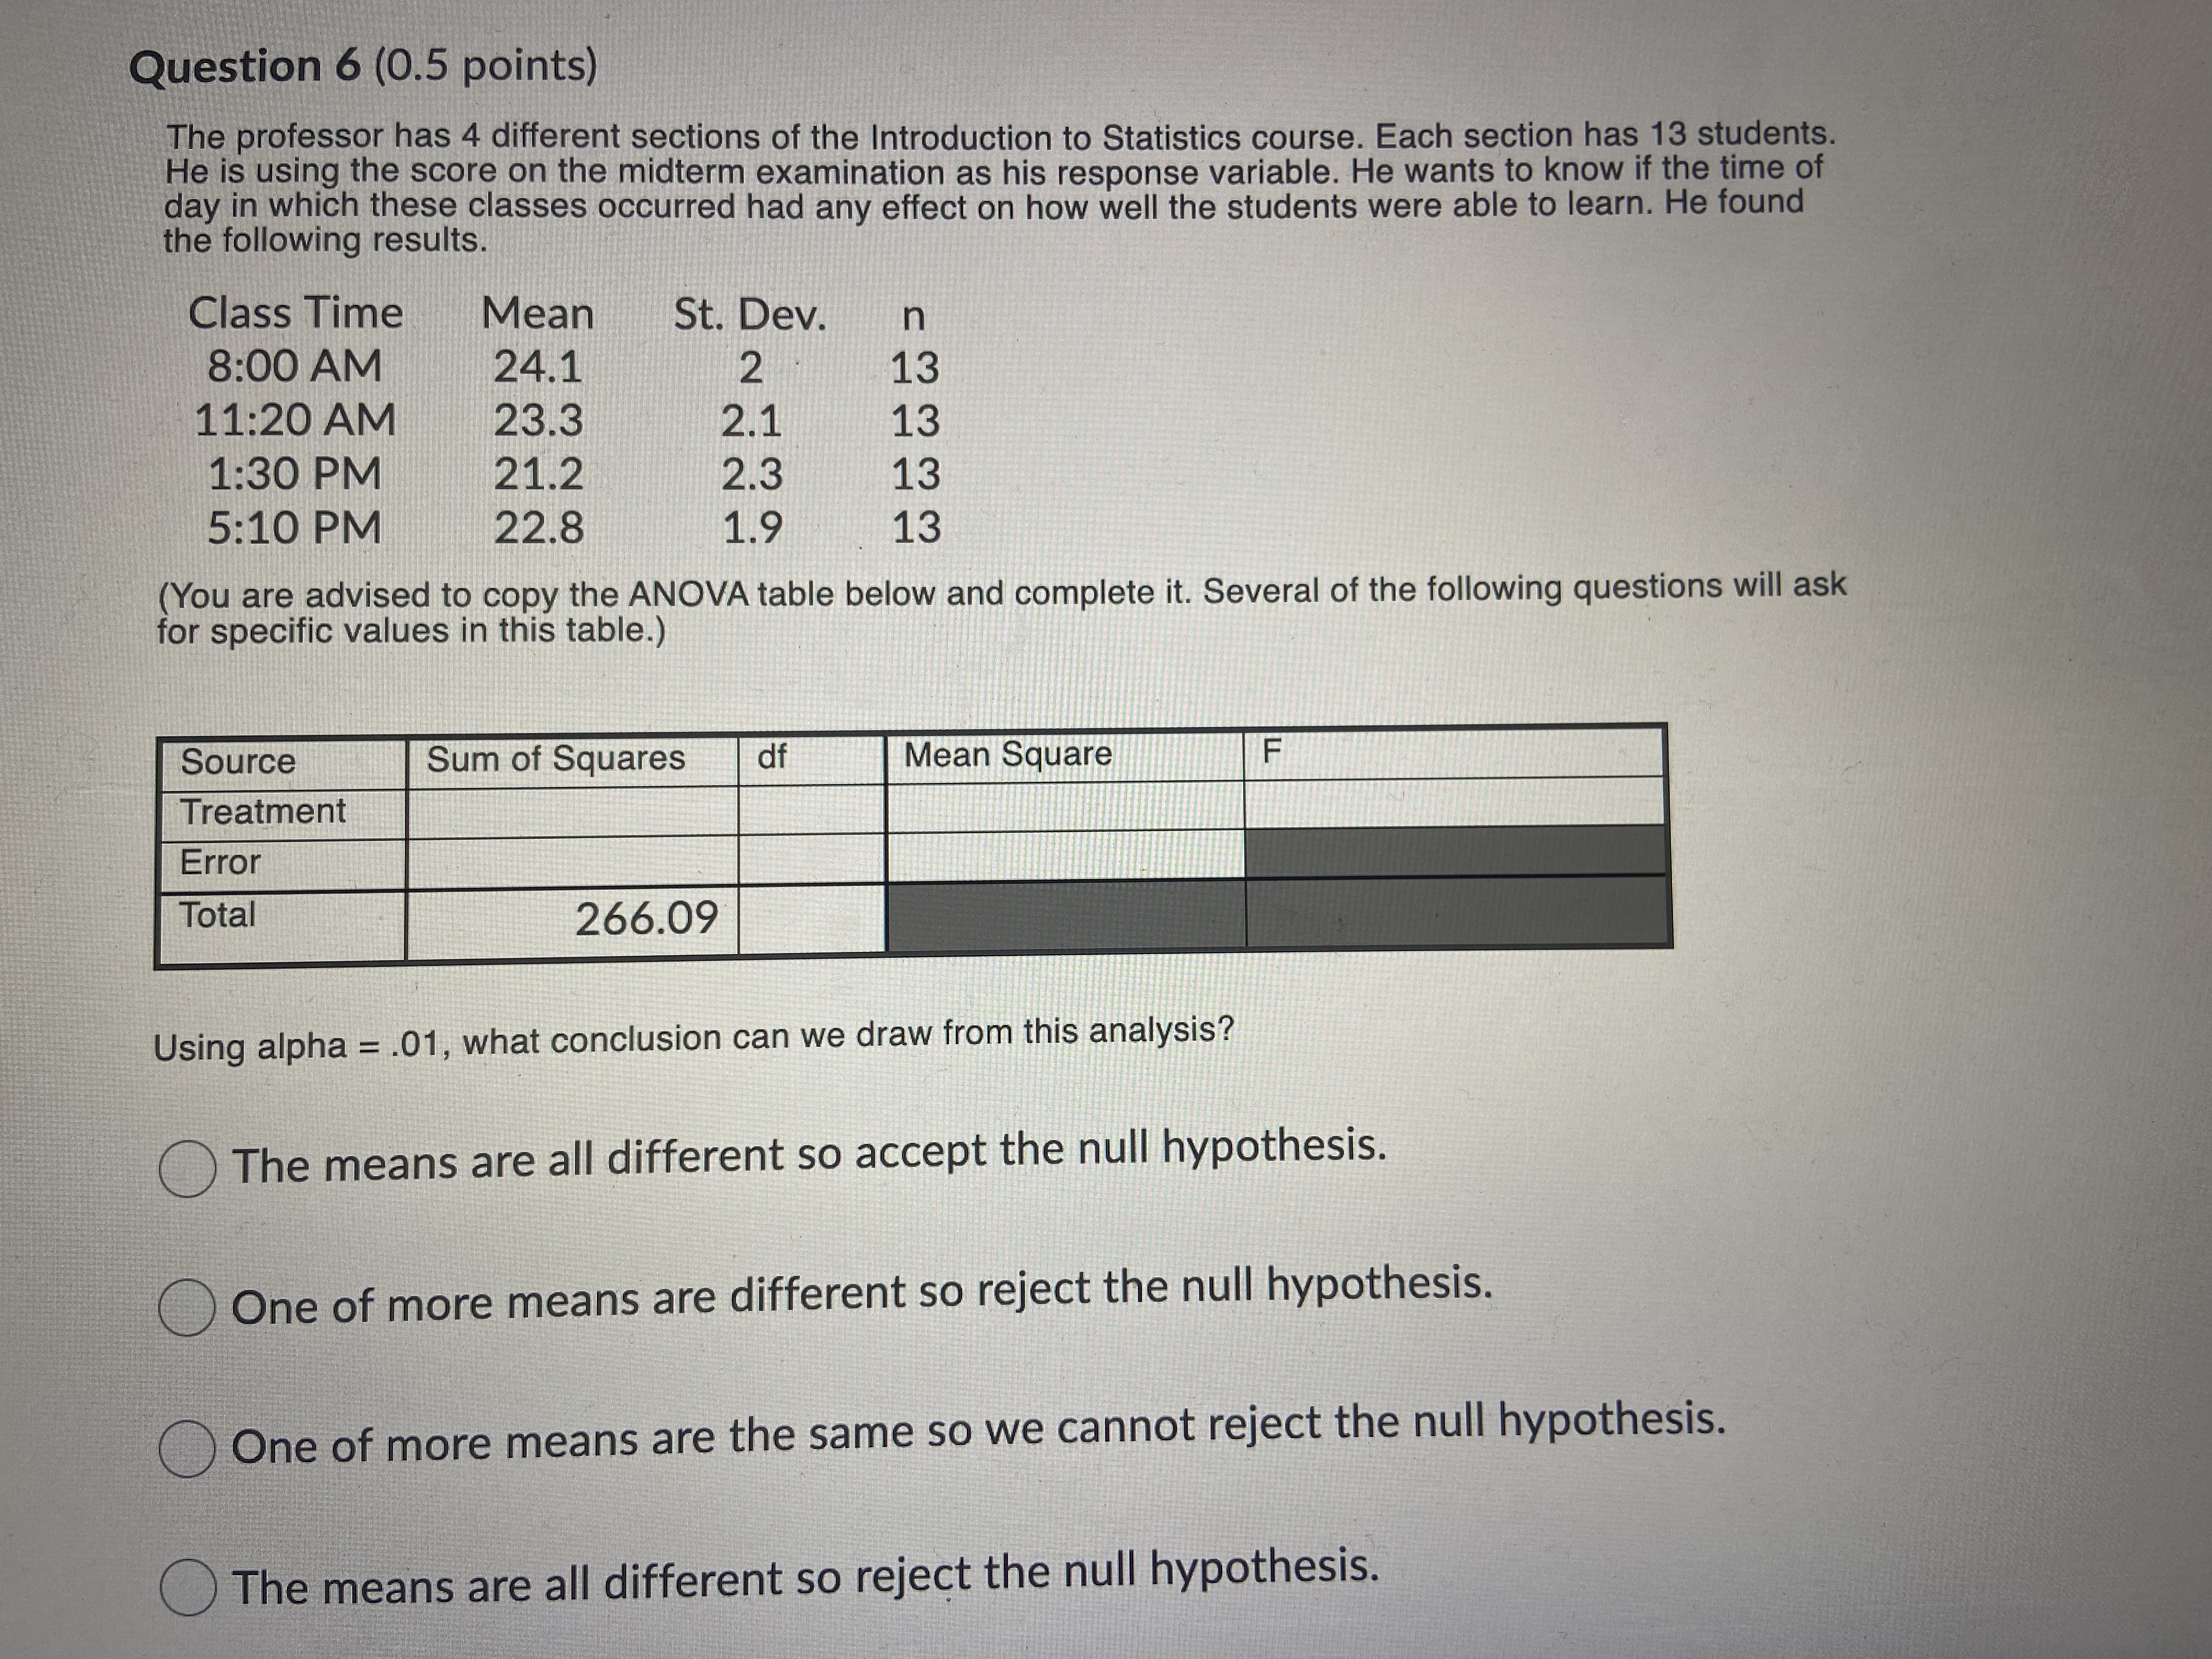
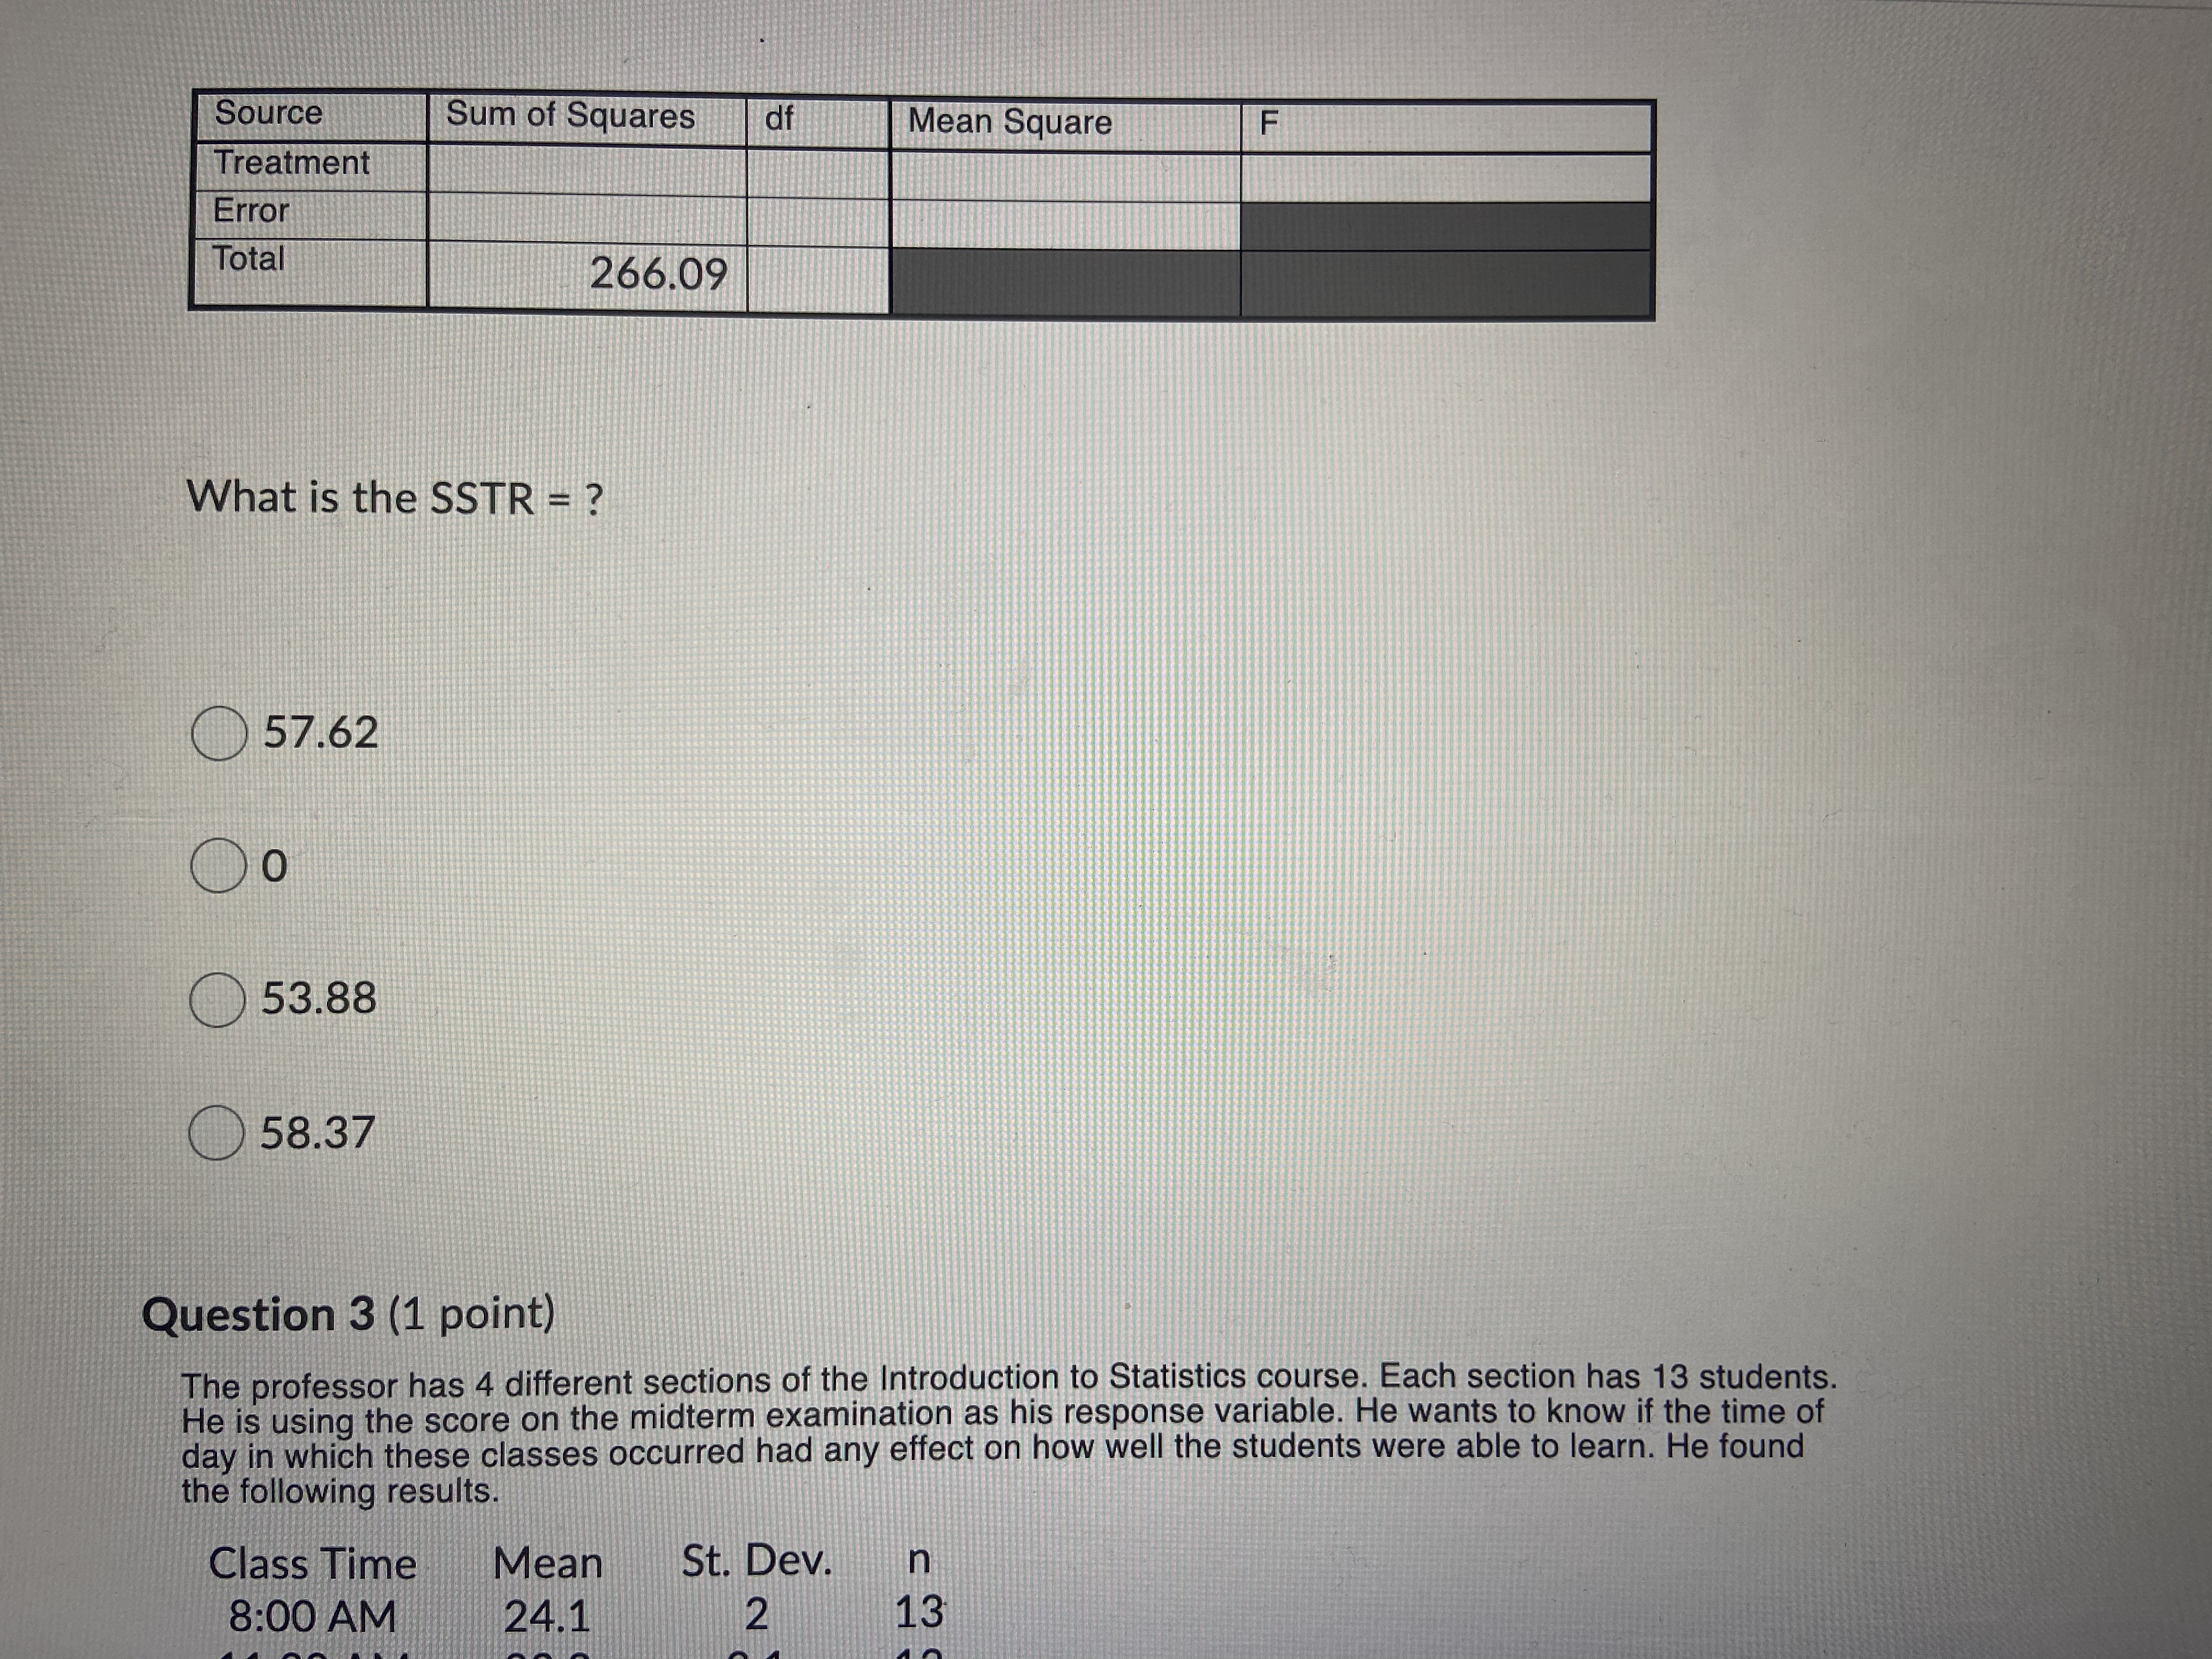
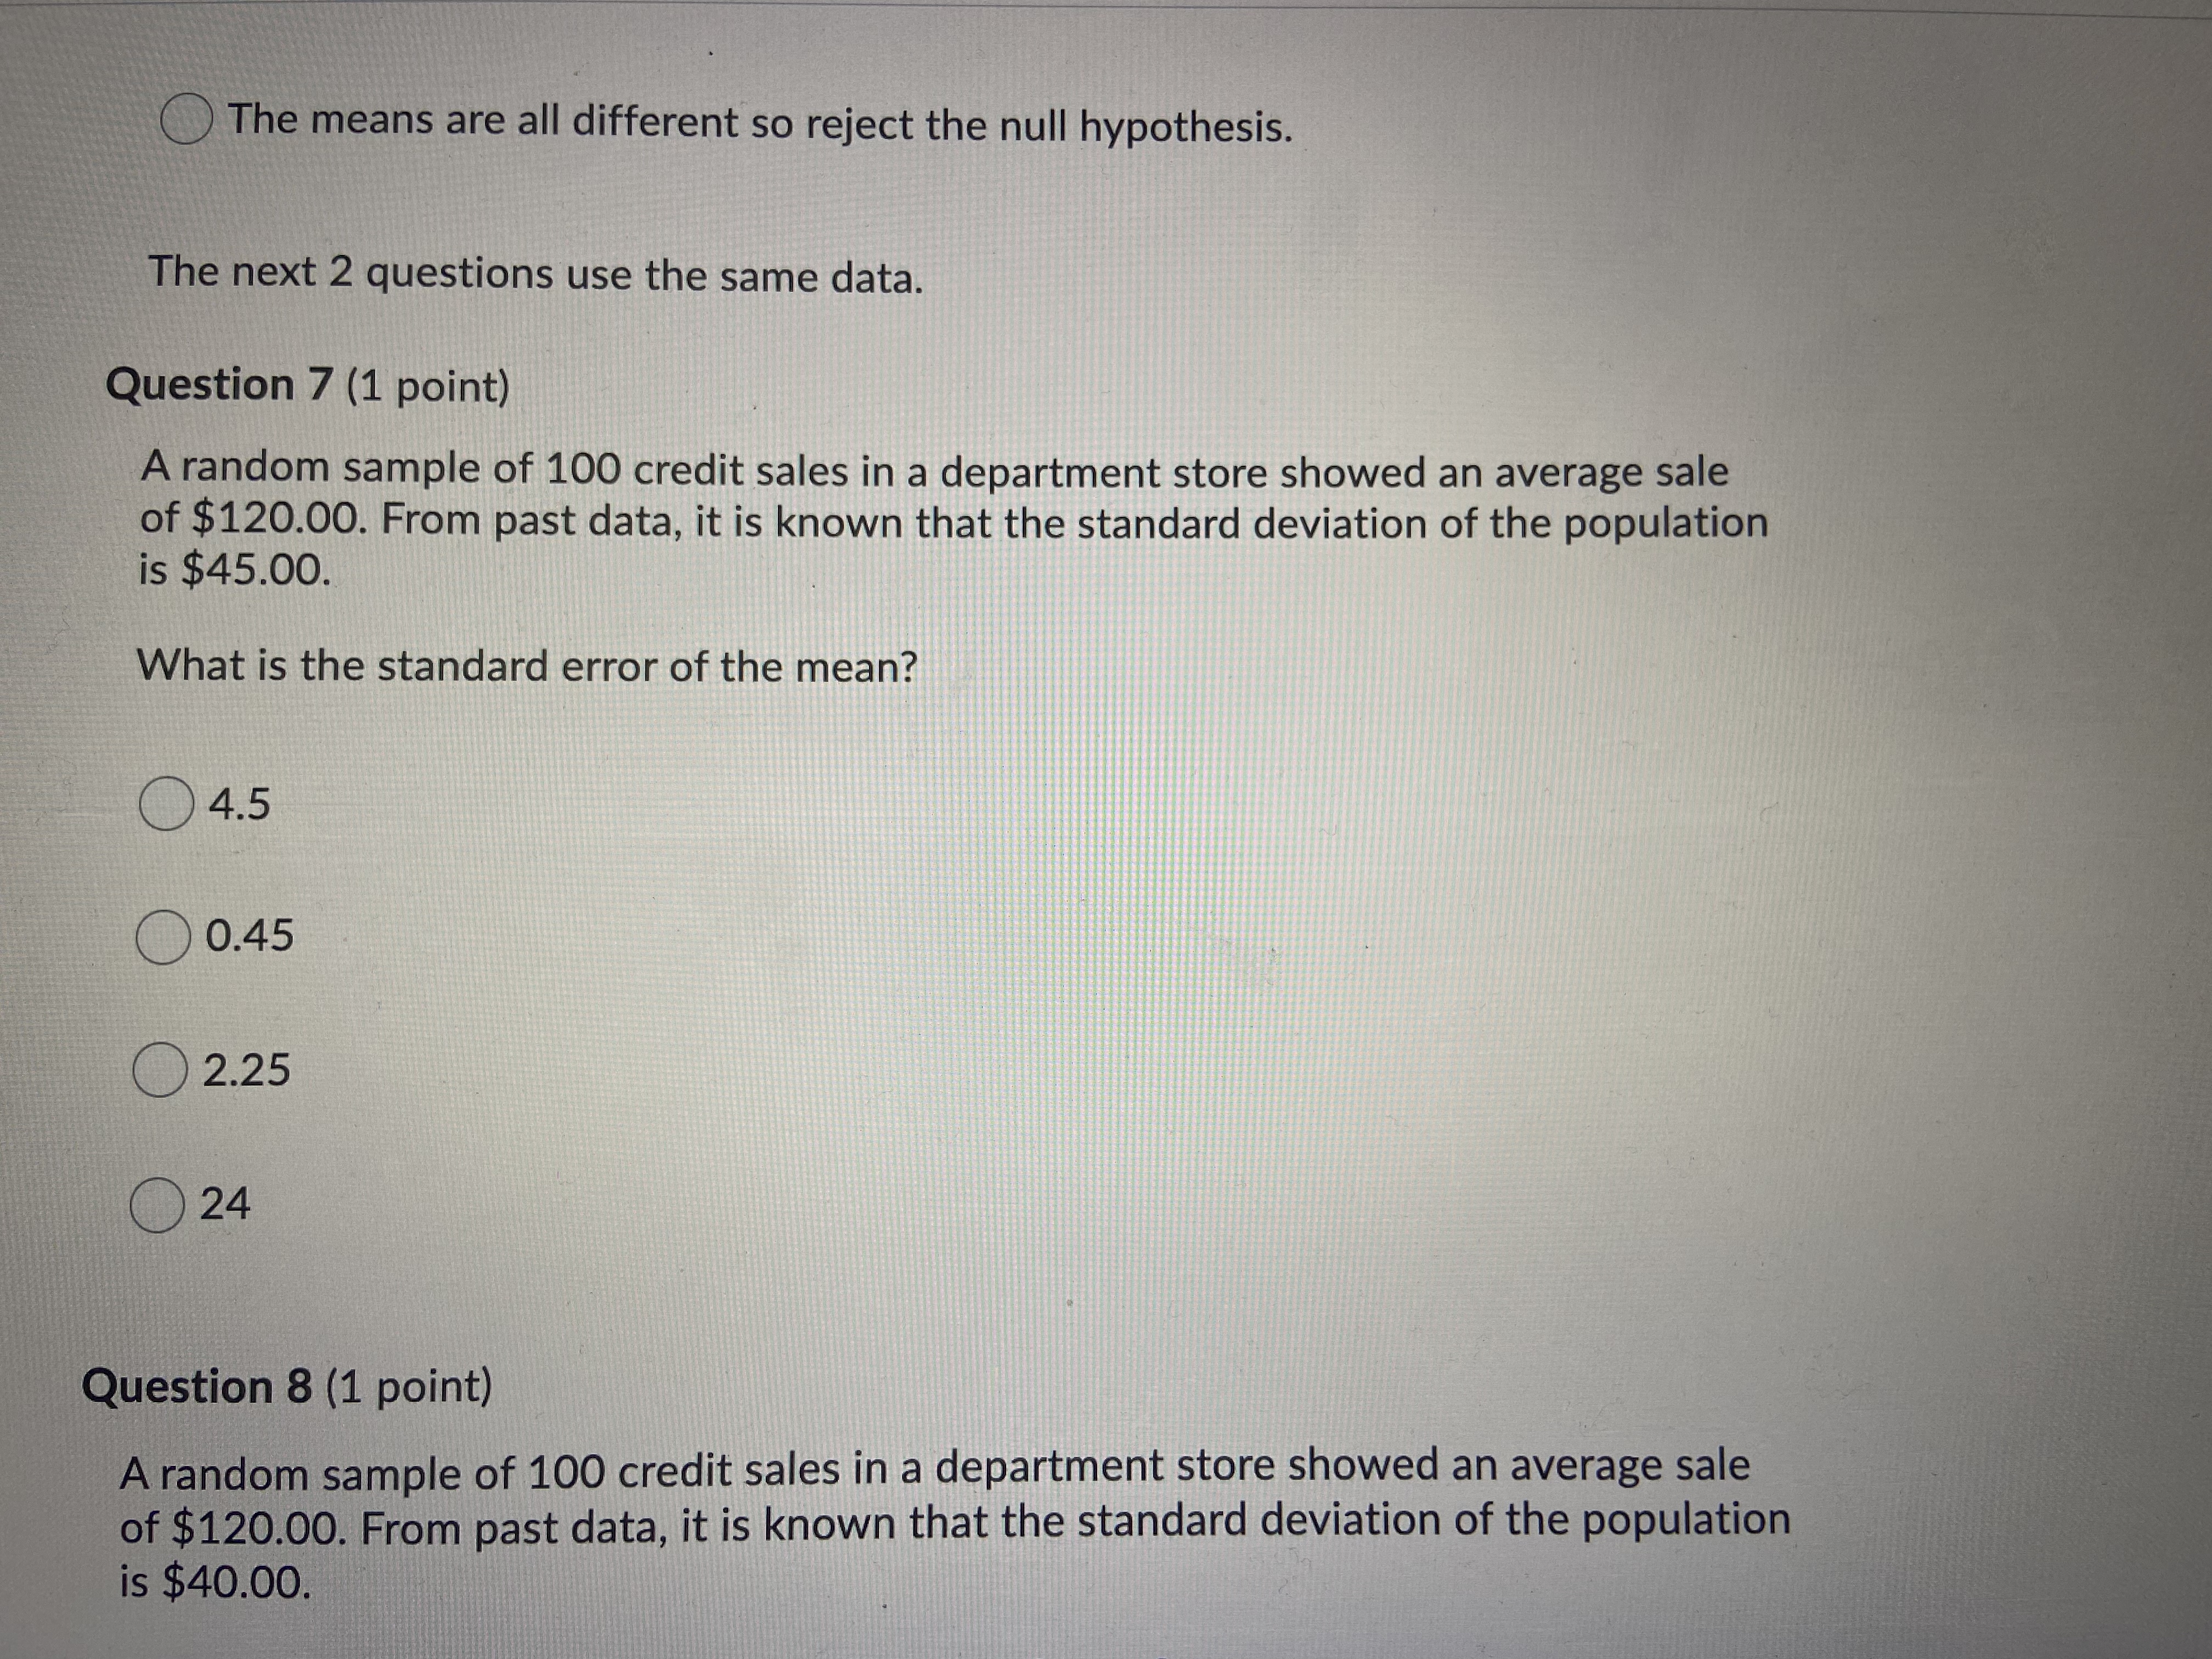
Class Time Mean St. Dev. n 8:00 AM 24.1 2 13 11:20 AM 23.3 2.1 13 1:30 PM 21.2 2.3 13 5:10 PM 22.8 1.9 13 (You are advised to copy the ANOVA table below and complete it. Several of the following questions will ask for specific values in this table.) Source Sum of Squares df Mean Square F Treatment Error Total 266.09 What is the degrees of freedom for denominator = 52 47 48 49 Question 4 (1 point)Question 5 (0.5 points) The professor has 4 different sections of the Introduction to Statistics course. Each section has 13 students. He is using the score on the midterm examination as his response variable. He wants to know if the time of day in which these classes occurred had any effect on how well the students were able to learn. He found the following results. Class Time Mean St. Dev. n 8:00 AM 24.1 2 13 11:20 AM 23.3 2.1 13 1:30 PM 21.2 2.3 13 5:10 PM 22.8 1.9 13 (You are advised to copy the ANOVA table below and complete it. Several of the following questions will ask for specific values in this table.) Source Sum of Squares df Mean Square F Treatment Error Total 266.09 Value of F=? 4.68 4.59 5.02 4.50Question 4 (1 point) The professor has 4 different sections of the Introduction to Statistics course. Each section has 13 students. He is using the score on the midterm examination as his response variable. He wants to know if the time of day in which these classes occurred had any effect on how well the students were able to learn. He found the following results. Class Time Mean St. Dev. n 8:00 AM 24.1 2 13 11:20 AM 23.3 2.1 13 1:30 PM 21.2 2.3 13 5:10 PM 22.8 1.9 13 (You are advised to copy the ANOVA table below and complete it. Several of the following questions will ask for specific values in this table.) Source Sum of Squares df Mean Square F Treatment Error Total 266.09 MSTR=? 14.60 19.46 29.18 20.21O0.45 2.25 O 24 Question 8 (1 point) A random sample of 100 credit sales in a department store showed an average sale of $120.00. From past data, it is known that the standard deviation of the population is $40.00. With a probability of .95, what is the margin of error? 8.82 8.86 8.928 -8.84 All the questions in this section use the same data set. Writing down your answers might make it easier to answer the later questions.What is the grand mean? x =? 20.57 21.60 22.3 22.85 Question 2 (1 point) The professor has 4 different sections of the Introduction to Statistics course. Each section has 13 students. He is using the score on the midterm examination as his response variable. He wants to know if the time of day in which these classes occurred had any effect on how well the students were able to learn. He found the following results. Class Time Mean St. Dev. n 8:00 AM 24.1 2 13 11:20 AM 23.3 2.1 13 1:30 PM 21.2 2.3 13 5:10 PM 22.8 1.9 13 ( You are advised to copy the ANOVA table below and complete it. Several of the following questions will ask or specific values in this table.)Question 1 (1 point) The professor has 4 different sections of the Introduction to Statistics course. Each section has 13 students. He is using the score on the midterm examination as his response variable. He wants to know if the time of day in which these classes occurred had any effect on how well the students were able to learn. He found the following results. Class Time Mean St. Dev. n 8:00 AM 24.1 2 13 11:20 AM 23.2 2.1 13 1:30 PM 21.2 2.3 13 5:10 PM 22.8 1.9 13 (You are advised to copy the ANOVA table below and complete it. Several of the following questions will ask for specific values in this table.) Source Sum of df Mean F Squares Square Treatment Error Total 266.09 What is the grand mean? x =? 20.57 21.60Question 6 (0.5 points) The professor has 4 different sections of the Introduction to Statistics course. Each section has 13 students. He is using the score on the midterm examination as his response variable. He wants to know if the time of day in which these classes occurred had any effect on how well the students were able to learn. He found the following results. Class Time Mean St. Dev. n 8:00 AM 24.1 2 13 11:20 AM 23.3 2.1 13 1:30 PM 21.2 2.3 13 5:10 PM 22.8 1.9 13 (You are advised to copy the ANOVA table below and complete it. Several of the following questions will ask for specific values in this table.) Source Sum of Squares df Mean Square F Treatment Error Total 266.09 Using alpha = .01, what conclusion can we draw from this analysis? The means are all different so accept the null hypothesis. One of more means are different so reject the null hypothesis. One of more means are the same so we cannot reject the null hypothesis. The means are all different so reject the null hypothesis.Source Sum of Squares df Mean Square F Treatment Error Total 266.09 What is the SSTR - ? 57.62 Oo 53.88 58.37 Question 3 (1 point) The professor has 4 different sections of the Introduction to Statistics course. Each section has 13 students. He is using the score on the midterm examination as his response variable. He wants to know if the time of day in which these classes occurred had any effect on how well the students were able to learn. He found the following results Class Time Mean St. Dev. n 8:00 AM 24.1 2 13The means are all different so reject the null hypothesis. The next 2 questions use the same data. Question 7 (1 point) A random sample of 100 credit sales in a department store showed an average sale of $120.00. From past data, it is known that the standard deviation of the population is $45.00. What is the standard error of the mean? 4.5 0.45 2.25 24 Question 8 (1 point) A random sample of 100 credit sales in a department store showed an average sale of $120.00. From past data, it is known that the standard deviation of the population is $40.00
Step by Step Solution
There are 3 Steps involved in it

Get step-by-step solutions from verified subject matter experts