

Question: A small grocery store has only one checkout counter. Customers arrive at this checkout counter at random from 1 to 8 minutes apart. Each
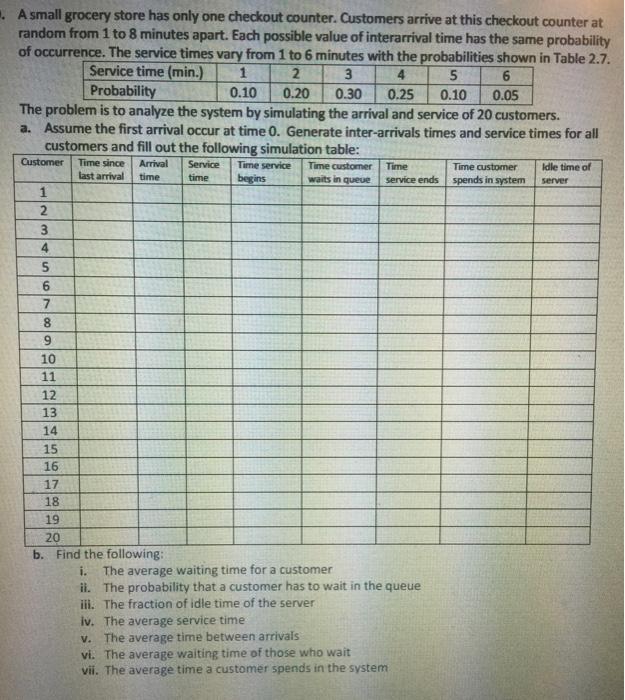
A small grocery store has only one checkout counter. Customers arrive at this checkout counter at random from 1 to 8 minutes apart. Each possible value of interarrival time has the same probability of occurrence. The service times vary from 1 to 6 minutes with the probabilities shown in Table 2.7. 2 3 4 5 0.20 0.30 0.25 0.10 Service time (min.) 6 Probability 0.05 The problem is to analyze the system by simulating the arrival and service of 20 customers. a. Assume the first arrival occur at time 0. Generate inter-arrivals times and service times for all customers and fill out the following simulation table: Customer 1 2 3 4 56 7 8 9 10 11 23456 12 13 14 15 16 17 18 19 22 20 Time since last arrival 1 0.10 Arrival Service Time service Time customer Time time begins time b. Find the following: Time customer waits in queue service ends spends in system i. The average waiting time for a customer ii. The probability that a customer has to wait in the queue iii. The fraction of idle time of the server iv. The average service time v. The average time between arrivals vi. The average waiting time of those who wait vii. The average time a customer spends in the system. Idle time of server
Step by Step Solution
3.44 Rating (170 Votes )
There are 3 Steps involved in it

Get step-by-step solutions from verified subject matter experts