

Question: Classify the following graph as a cross-sectional study or a time-series study. Answer 2 Points Scores Average Quiz Scores 100 80 60- 40 20-
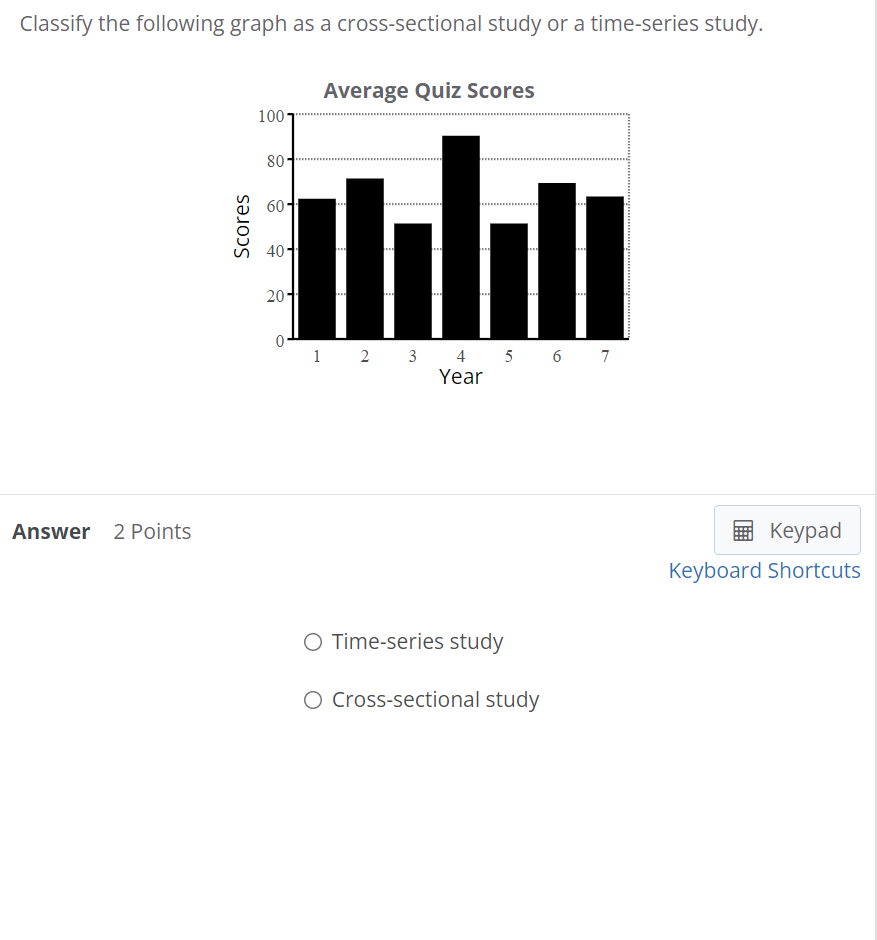
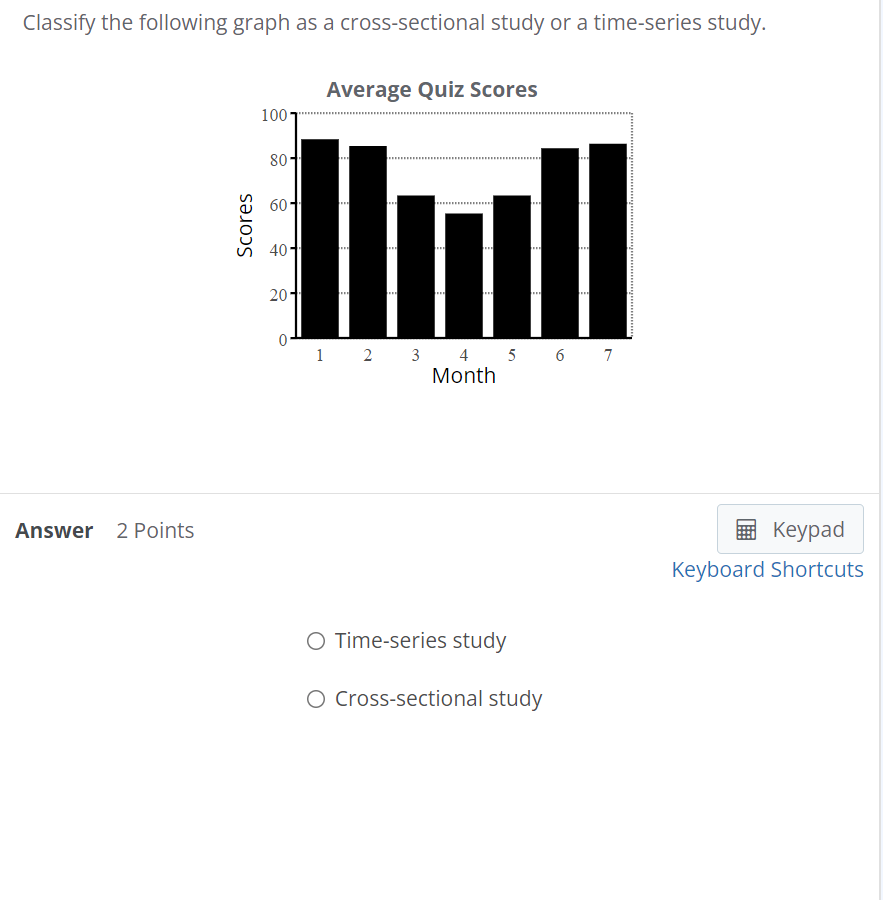
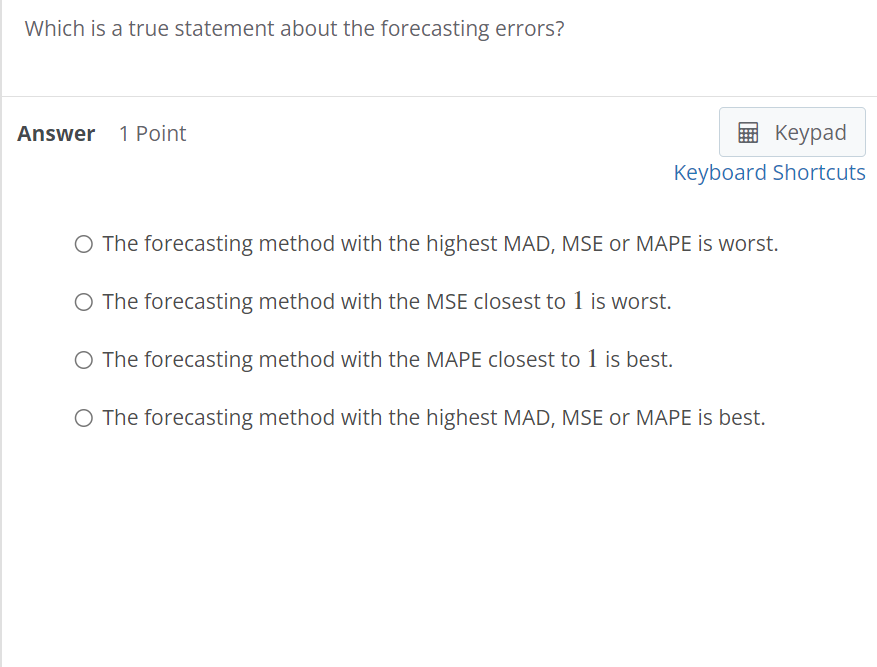
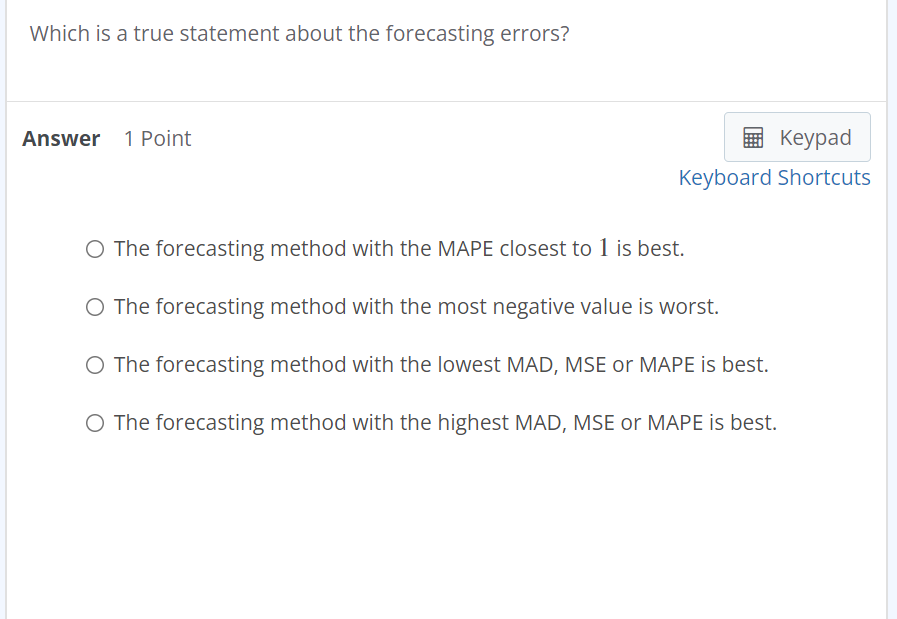
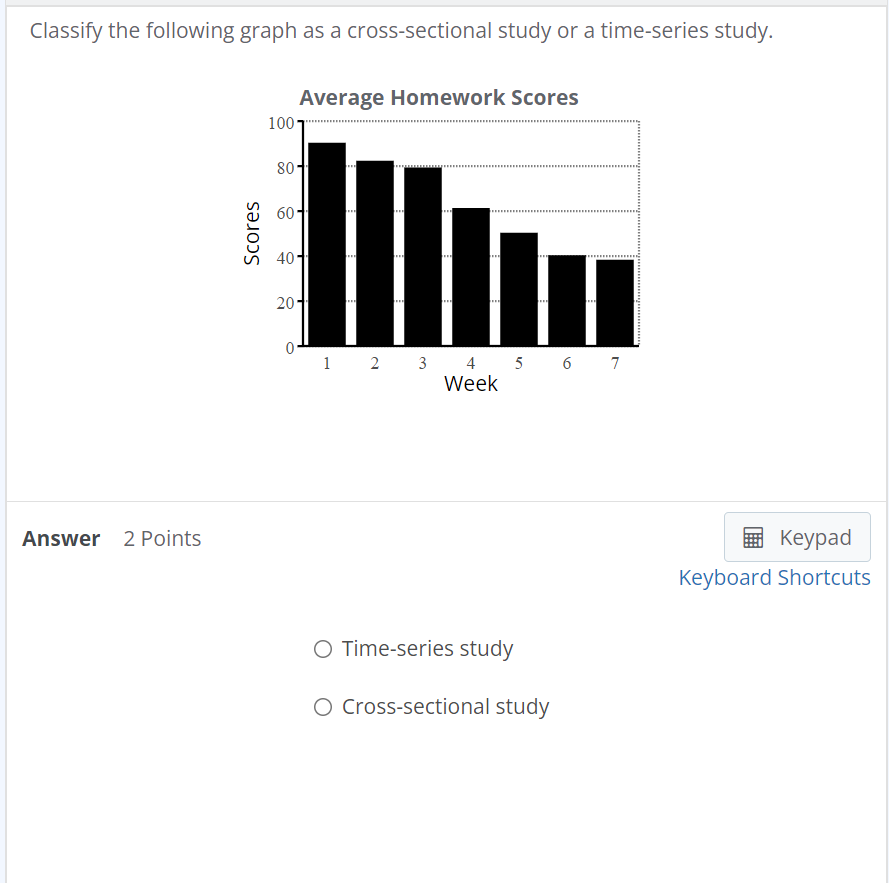
Classify the following graph as a cross-sectional study or a time-series study. Answer 2 Points Scores Average Quiz Scores 100 80 60- 40 20- 1 2 3 4567 Year O Time-series study Cross-sectional study Keypad Keyboard Shortcuts Classify the following graph as a cross-sectional study or a time-series study. Answer 2 Points Scores Average Quiz Scores 100 80 60 40 20 0 1 2 3 4 5 6 7 Month O Time-series study Cross-sectional study Keypad Keyboard Shortcuts Which is a true statement about the forecasting errors? Answer 1 Point Keypad Keyboard Shortcuts The forecasting method with the highest MAD, MSE or MAPE is worst. The forecasting method with the MSE closest to 1 is worst. The forecasting method with the MAPE closest to 1 is best. The forecasting method with the highest MAD, MSE or MAPE is best. Which is a true statement about the forecasting errors? Answer 1 Point Keypad The forecasting method with the MAPE closest to 1 is best. Keyboard Shortcuts The forecasting method with the most negative value is worst. The forecasting method with the lowest MAD, MSE or MAPE is best. The forecasting method with the highest MAD, MSE or MAPE is best. Classify the following graph as a cross-sectional study or a time-series study. 100' 80' Average Homework Scores Answer 2 Points Scores 60 40 20 0 1 2 3 4 5 6 7 Week O Time-series study Cross-sectional study Keypad Keyboard Shortcuts
Step by Step Solution
There are 3 Steps involved in it

Get step-by-step solutions from verified subject matter experts