

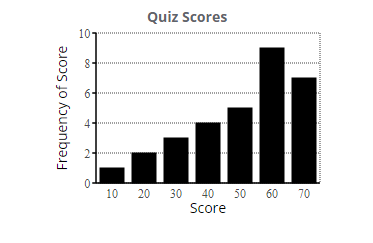
Question: Classify the following graph as a cross-sectional study or a time-series study. Quiz Scores 10 Frequency of Score 2 10 20 30 40 50 60
Classify the following graph as a cross-sectional study or a time-series study.
Step by Step Solution
There are 3 Steps involved in it
1 Expert Approved Answer
Step: 1 Unlock

Question Has Been Solved by an Expert!
Get step-by-step solutions from verified subject matter experts
Step: 2 Unlock
Step: 3 Unlock