

Question: Clear explanation please .. Q2. In the image below it is shown the Project Cost - Duration Graph. (9 points) Describe in detail the three
Clear explanation please .. 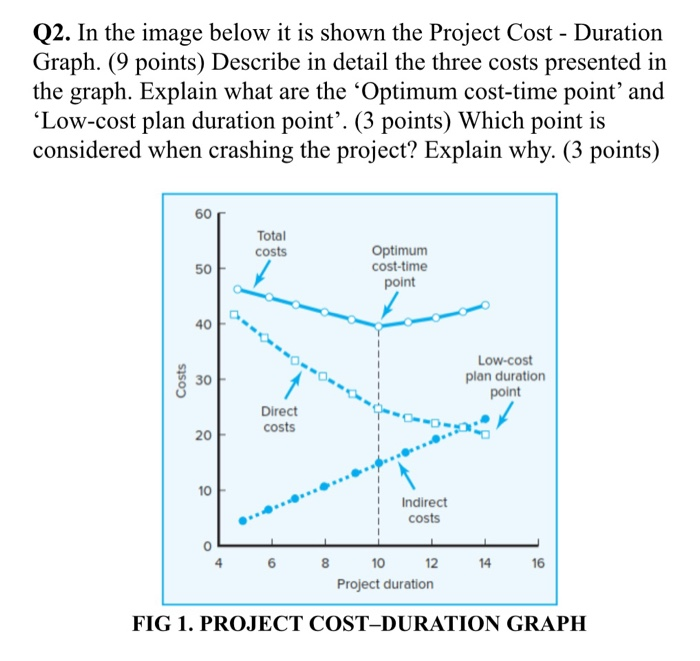
Q2. In the image below it is shown the Project Cost - Duration Graph. (9 points) Describe in detail the three costs presented in the graph. Explain what are the Optimum cost-time point and Low-cost plan duration point. (3 points) Which point is considered when crashing the project? Explain why. (3 points) 60 Total costs 50 Optimum cost-time point 40 Costs 30 30 Low-cost plan duration point Direct costs 20 10 Indirect costs 6 8 14 10 12 Project duration 16 FIG 1. PROJECT COST-DURATION GRAPH
Step by Step Solution
There are 3 Steps involved in it
1 Expert Approved Answer
Step: 1 Unlock

Question Has Been Solved by an Expert!
Get step-by-step solutions from verified subject matter experts
Step: 2 Unlock
Step: 3 Unlock