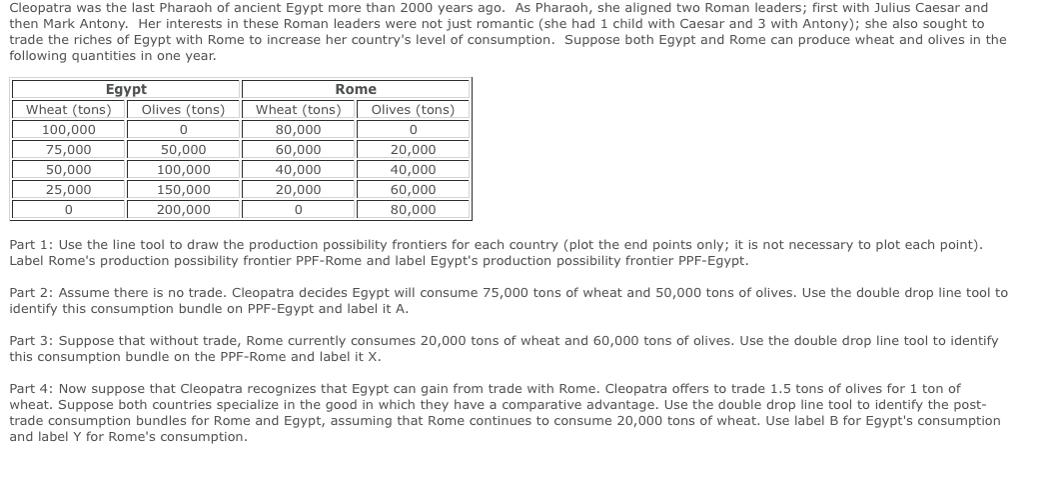
Cleopatra was the last Pharaoh of ancient Egypt more than 2000 years ago. As Pharaoh, she...
Fantastic news! We've Found the answer you've been seeking!
Question:
Transcribed Image Text:
Cleopatra was the last Pharaoh of ancient Egypt more than 2000 years ago. As Pharaoh, she aligned two Roman leaders; first with Julius Caesar and then Mark Antony. Her interests in these Roman leaders were not just romantic (she had 1 child with Caesar and 3 with Antony); she also sought to trade the riches of Egypt with Rome to increase her country's level of consumption. Suppose both Egypt and Rome can produce wheat and olives in the following quantities in one year. Egypt Wheat (tons) 100,000 75,000 50,000 25,000 0 Olives (tons) 0 50,000 100,000 150,000 200,000 Rome Wheat (tons) 80,000 60,000 40,000 20,000 0 Olives (tons) 0 20,000 40,000 60,000 80,000 Part 1: Use the line tool to draw the production possibility frontiers for each country (plot the end points only; it is not necessary to plot each point). Label Rome's production possibility frontier PPF-Rome and label Egypt's production possibility frontier PPF-Egypt. Part 2: Assume there is no trade. Cleopatra decides Egypt will consume 75,000 tons of wheat and 50,000 tons of olives. Use the double drop line tool to identify this consumption bundle on PPF-Egypt and label it A. Part 3: Suppose that without trade, Rome currently consumes 20,000 tons of wheat and 60,000 tons of olives. Use the double drop line tool to identify this consumption bundle on the PPF-Rome and label it X. Part 4: Now suppose that Cleopatra recognizes that Egypt can gain from trade with Rome. Cleopatra offers to trade 1.5 tons of olives for 1 ton of wheat. Suppose both countries specialize in the good in which they have a comparative advantage. Use the double drop line tool to identify the post- trade consumption bundles for Rome and Egypt, assuming that Rome continues to consume 20,000 tons of wheat. Use label B for Egypt's consumption and label Y for Rome's consumption. Bishop, California is a small town located in the High Sierras between Death Valley and Mount Whitney. In Bishop there is only one pizza parlor, the Pizza Factory. The table below shows the demand for pizza on a Friday night in Bishop. Given this information, use the multi-point line tool to plot Bishop's demand curve for pizza. Make sure to label the demand curve. Price of a large pizza Quantity of large pizzas demanded $50 $40 $30 $25 $20 $15 $10 $5 20 30 44 50 65 180 100 140 Cleopatra was the last Pharaoh of ancient Egypt more than 2000 years ago. As Pharaoh, she aligned two Roman leaders; first with Julius Caesar and then Mark Antony. Her interests in these Roman leaders were not just romantic (she had 1 child with Caesar and 3 with Antony); she also sought to trade the riches of Egypt with Rome to increase her country's level of consumption. Suppose both Egypt and Rome can produce wheat and olives in the following quantities in one year. Egypt Wheat (tons) 100,000 75,000 50,000 25,000 0 Olives (tons) 0 50,000 100,000 150,000 200,000 Rome Wheat (tons) 80,000 60,000 40,000 20,000 0 Olives (tons) 0 20,000 40,000 60,000 80,000 Part 1: Use the line tool to draw the production possibility frontiers for each country (plot the end points only; it is not necessary to plot each point). Label Rome's production possibility frontier PPF-Rome and label Egypt's production possibility frontier PPF-Egypt. Part 2: Assume there is no trade. Cleopatra decides Egypt will consume 75,000 tons of wheat and 50,000 tons of olives. Use the double drop line tool to identify this consumption bundle on PPF-Egypt and label it A. Part 3: Suppose that without trade, Rome currently consumes 20,000 tons of wheat and 60,000 tons of olives. Use the double drop line tool to identify this consumption bundle on the PPF-Rome and label it X. Part 4: Now suppose that Cleopatra recognizes that Egypt can gain from trade with Rome. Cleopatra offers to trade 1.5 tons of olives for 1 ton of wheat. Suppose both countries specialize in the good in which they have a comparative advantage. Use the double drop line tool to identify the post- trade consumption bundles for Rome and Egypt, assuming that Rome continues to consume 20,000 tons of wheat. Use label B for Egypt's consumption and label Y for Rome's consumption. Bishop, California is a small town located in the High Sierras between Death Valley and Mount Whitney. In Bishop there is only one pizza parlor, the Pizza Factory. The table below shows the demand for pizza on a Friday night in Bishop. Given this information, use the multi-point line tool to plot Bishop's demand curve for pizza. Make sure to label the demand curve. Price of a large pizza Quantity of large pizzas demanded $50 $40 $30 $25 $20 $15 $10 $5 20 30 44 50 65 180 100 140
Expert Answer:
Answer rating: 100% (QA)
Part 1 Production Possibility Frontiers The production possibility frontier PPF is a curve that shows the different combinations of two goods that a c... View the full answer
Related Book For
Posted Date:
Students also viewed these economics questions
-
Managing Scope Changes Case Study Scope changes on a project can occur regardless of how well the project is planned or executed. Scope changes can be the result of something that was omitted during...
-
In the neighboring groups of New Yorkers and New Jersians, each produces only two products, bagels and calzones. By themselves, the New Yorkers, each day, can produce either 45 pounds of bagels and...
-
Assume there are two countries in the world, Highland (H) and lowland (L). Both countries are initially self-sufficient in that they do not trade with each other, a condition called "autarky." Each...
-
What were the worst mistakes made by Globestelle during the production development process ? CASE 15 Case date 2001 The Reltex Project Nigel Slack Globestelle is the world's largest precision...
-
In addition to the information presented in Mini Exercise 14.1, the following cost behavior patterns are budgeted for ABC Company's operating expenses each month: Fixed costs: salaries, $2,000; rent,...
-
Redo Exercise 5.6.1 using the weighted inner product (v, w) = v1w1 + 2v2w2 + 3v3w3 instead of the dot product.
-
Prepare the current assets section of the balance sheet as of December 31,2010, for Lipton, Inc., using the following information: Accounts Receivable. Petty Cash.. Cash in Bank Accounts Inventory......
-
Bruce is considering the purchase of a restaurant named Hard Rock Hollywood. The restaurant is listed for sale at $1,000,000. With the help of his accountant, Bruce projects the net cash flows (cash...
-
Jaguar Plastics Company has been operating for three years. At December 31 of last year, the accounting records reflected the following: Cash $21,000 Accounts payable $19,000 Investments (short-term)...
-
Consider the unadjusted trial balance of Burrows Landscaping at December 31, 2023, and the related month-end adjustment data: The following adjustments need to be made on December 31 before the...
-
In contemporary routing and addressing, the notation commonly used is called Classless interdomain routing or CIDR. With CIDR, the number of bits in the mask is indicated in the following fashion:...
-
The following laboratory test data were obtained for a soil sample: Sample volume 0.56 ft3 Sample weight 62 lb Dry sample weight 50 lb Specific gravity 2.64 6.1 The void ratio of this sample is most...
-
Once you have identified a conflict of interest, how do you plan to maintain this standard? "Clarify the role of the health and wellness coach, establish boundaries, and discuss conflicts of interest...
-
Products or Services Analysis .. PRODUCT/COMPANY THAT DOING IN MALAYSIA . TASK -Who is your supplier *At least 3 suppliers Name product/services: clothes (fashion) H'four collections (business name)...
-
The housing foreclosure crisis has been particularly devastating in housing markets in much of the south and west United States, but even when analysis is restricted to relatively strong housing...
-
Grant Date: $6 January 1, year 1 Vesting Date: $16 January 1, year 3 Exercise Date: $24 January 1, year 5 Sale Date: $30 January 1, year 7 Jo Jo receives the following equity-based compensation from...
-
Assume communication company offers a free to air TV program which uses 8PSK for modulation. Assume further, the TV channel uses a channel from 500 MHz to 505 MHz and the selected symbol frequency...
-
Do public and private companies follow the same set of accounting rules? Explain.
-
The article "Computing and Using Rural versus Urban Measures in Statistical Applications" (C. Goodall, K. Kafadar, and J. Tukey, The American Statistician, 1998:101-111) discusses methods to measure...
-
A particular automatic sprinkler system has two different types of activation devices for each sprinkler head. One type has a reliability of 0.9; that is, the probability that it will activate the...
-
A certain make of car comes equipped with an engine in one of four sizes (in liters): 2.8, 3.0, 3.3, or 3.8. Ten percent of customers order the 2.8 liter engine, 40% order the 3.0, 30% order the 3.3,...
-
How do you find the inverse of an upper triangular matrix?
-
What is the role of Choleski decomposition in deriving a standard eigenvalue problem?
-
A two-story shear building is shown in Fig. 7.14 in which the floors are assumed to be rigid. Using Rayleigh's method, compute the first natural frequency of the building for \(m_{1}=2 m, m_{2}=m,...
Study smarter with the SolutionInn App