

Question: Click here for the Excel Dota File (a) What kind of display is this? Bar chart with 3D visual effect Histogram Column chart with 3D
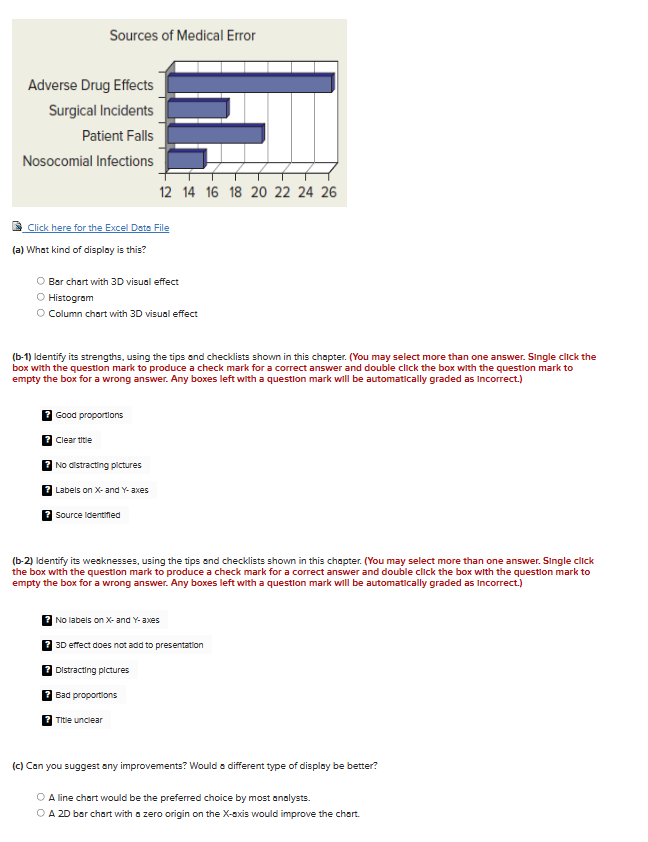
Click here for the Excel Dota File (a) What kind of display is this? Bar chart with 3D visual effect Histogram Column chart with 3D visual effect (b-1) ldentify its strengths, using the tips and checklists shown in this chapter. (You may select more than one answer. Single click the box with the question mark to produce a check mark for a correct answer and double click the box with the question mark to empty the box for a wrong answer. Any boxes left with a question mark will be automatically graded as incorrect.) ? Good proportions Clear title No alstracting pictures Labels on X - and Y - axes Source identhed (b-2) Identify its wesknesses, using the tips and checklists shown in this chapter. (You may select more than one answer. Slngle click the box with the question mark to produce a check mark for a correct answer and double click the box with the question mark to empty the box for a wrong answer. Any boxes left with a question mark will be automatically graded as incorrect.) No labels on X - and Y-axes 3D effect does not add to presentation Distracting plctures Bad proportions Title unclear (c) Can you suggest any improvements? Would o different type of display be better? A line chart would be the preferred choice by most analysts. A2D bor chart with a zero origin on the X-axis would improve the chart. Click here for the Excel Dota File (a) What kind of display is this? Bar chart with 3D visual effect Histogram Column chart with 3D visual effect (b-1) ldentify its strengths, using the tips and checklists shown in this chapter. (You may select more than one answer. Single click the box with the question mark to produce a check mark for a correct answer and double click the box with the question mark to empty the box for a wrong answer. Any boxes left with a question mark will be automatically graded as incorrect.) ? Good proportions Clear title No alstracting pictures Labels on X - and Y - axes Source identhed (b-2) Identify its wesknesses, using the tips and checklists shown in this chapter. (You may select more than one answer. Slngle click the box with the question mark to produce a check mark for a correct answer and double click the box with the question mark to empty the box for a wrong answer. Any boxes left with a question mark will be automatically graded as incorrect.) No labels on X - and Y-axes 3D effect does not add to presentation Distracting plctures Bad proportions Title unclear (c) Can you suggest any improvements? Would o different type of display be better? A line chart would be the preferred choice by most analysts. A2D bor chart with a zero origin on the X-axis would improve the chart
Step by Step Solution
There are 3 Steps involved in it

Get step-by-step solutions from verified subject matter experts