

Question: CLICK HERE TO REVIEW LEARNING OBJECTIVES QUESTION 6 Answer saved Marked out of 10.00 P Flag question Comparing Profitability Ratios for Competitors Selected income statement
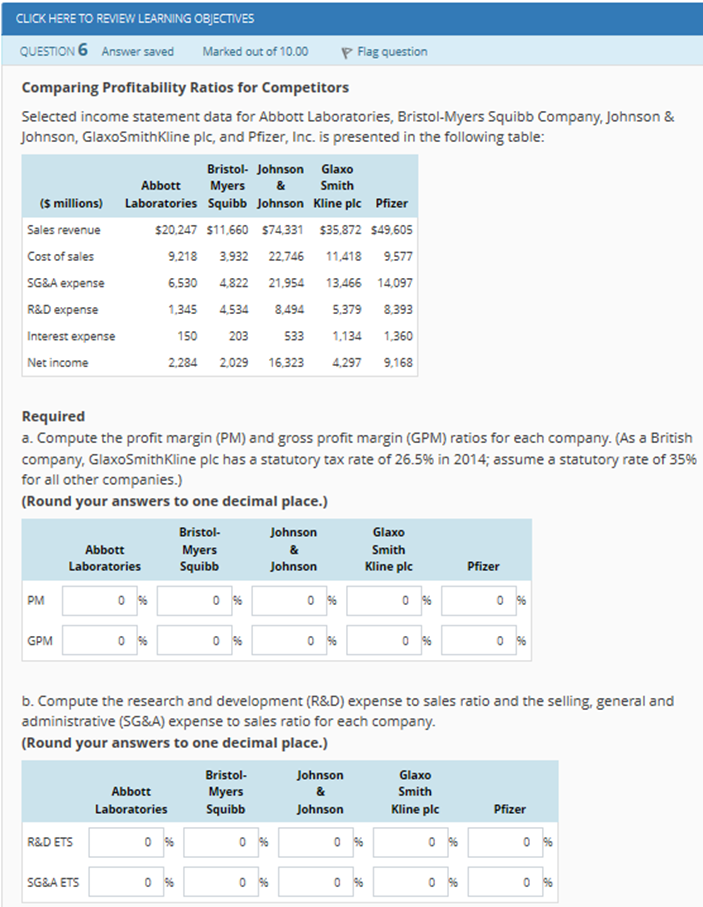
CLICK HERE TO REVIEW LEARNING OBJECTIVES QUESTION 6 Answer saved Marked out of 10.00 P Flag question Comparing Profitability Ratios for Competitors Selected income statement data for Abbott Laboratories, Bristol-Myers Squibb Company, Johnson & Johnson, GlaxoSmithKline plc, and Pfizer, Inc. is presented in the following table Bristol- Johnson Glaxo Smith Abbott Myers S millions) Laboratories Squibb Johnson Kline pic Pfizer Sales revenue Cost of sales SG&A expense R&D expense Interest expense Net income $20,247 S11,660 S74,331 $35,872 $49,605 9,218 3.932 22,746 11418 9.577 6,530 4,822 21.954 13.466 14,097 1345 4534 8494 5.379 8,39 50 203 533 1.134 1.360 2,284 2,029 16,3234,297 9,168 Required a. Compute the profit margin (PM) and gross profit margin (GPM) ratios for each company. (As a British company, GlaxoSmithKline plc has a statutory tax rate of 26.5% in 2014; assume a statutory rate of 35% for all other companies.) (Round your answers to one decimal place.) Bristol- Johnson Abbott Laboratories Glaxo Smith Kline plc Squibb Pfizer PM GPM b. Compute the research and development (R&D) expense to sales ratio and the selling, general and administrative (SG&A) expense to sales ratio for each company (Round your answers to one decimal place.) Abbott Laboratories Bristol- Myers Squibb Glaxo Smith Kline plc Pfizer R&D ETS 0% 0% 0% SG&A ETS 0%
Step by Step Solution
There are 3 Steps involved in it

Get step-by-step solutions from verified subject matter experts