

Question: CLICK HERE TO REVMEW LEARNING OBECTIVES QUESTION 7 Answer saved Marked out of 10.00 Flag question Comparing Profitability and Turnover Ratios for Retail Companies Selected
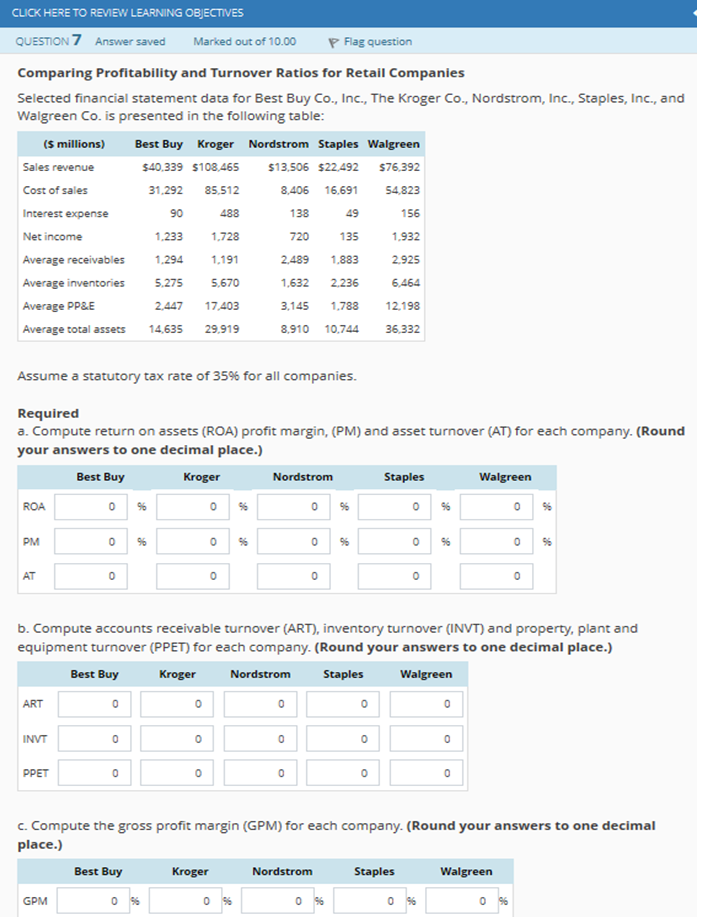
CLICK HERE TO REVMEW LEARNING OBECTIVES QUESTION 7 Answer saved Marked out of 10.00 Flag question Comparing Profitability and Turnover Ratios for Retail Companies Selected financial statement data for Best Buy Co., Inc., The Kroger Co., Nordstrom, Inc., Staples, Inc., and Walgreen Co. is presented in the following table 31.292 85,512 488 1.233 1728 Average receivables 1.294 1,191 5,670 2,44717403 Average total assets 14,635 29,919 Sales revenue Cost of sales Interest expense Net income (S millions) Best Buy Kroger Nordstrom Staples Walgreen $40.339 $108,465 $13,506 $22,492 S76.392 8,406 16,691 54,823 156 1.932 2.925 49 135 2,489 1,883 1,632 2.236 90 138 720 ge inventories5.275 5 Average PP&E 3,145 1.788 12198 8,910 10,74436,332 Assume a statutory tax rate of 35% for all companies. Required a. Compute return on assets (ROA) profit margin, (PM) and asset turnover (AT) for each company. (Round your answers to one decimal place.) Best Buy Kroger Walgreen 0% 0% 0% PM AT b. Compute accounts receivable turnover (ART), inventory turnover (INVT) and property, plant and equipment turnover (PPET) for each company. (Round your answers to one decimal place.) Best Buy Kroger Nordstrom Walgreen ART INVT PPET C. Compute the gross profit margin (GPM) for each company. (Round your answers to one decimal place.) Best Buy Staples Walgreer GPM
Step by Step Solution
There are 3 Steps involved in it

Get step-by-step solutions from verified subject matter experts