

Question: Click the icon to view the data. a . What is the appropriate control chart to use to monitor this process? A . Both an
Click the icon to view the data.
a What is the appropriate control chart to use to monitor this process?
A Both an Rchart and an chart
A pchart
C Acchart
D An chart
E An Rchart
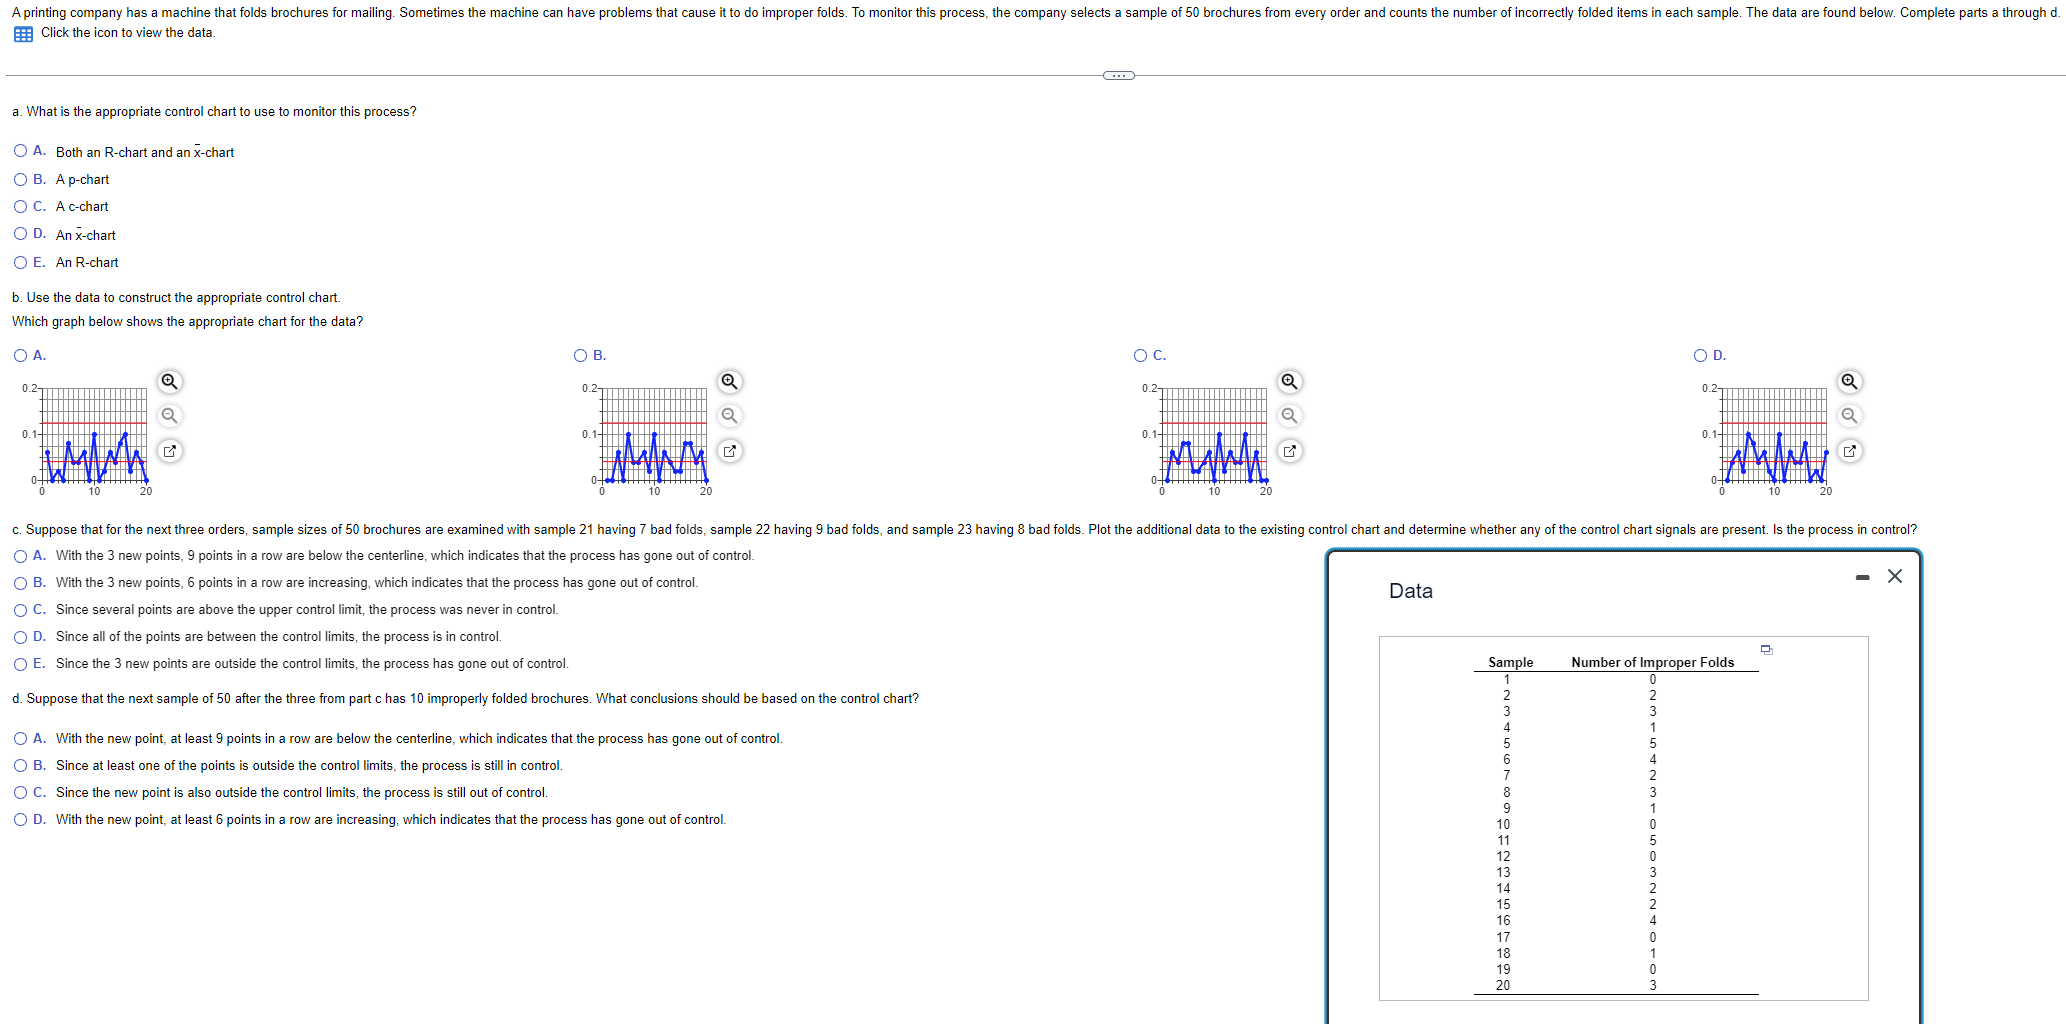
b Use the data to construct the appropriate control chart
Which graph below shows the appropriate chart for the data?
A
D
A With the new points, points in a row are below the centerline, which indicates that the process has gone out of control.
B With the new points, points in a row are increasing, which indicates that the process has gone out of control.
C Since several points are above the upper control limit the process was never in control.
D Since all of the points are between the control limits the process is in control.
E Since the new points are outside the control limits the process has gone out of control.
d Suppose that the next sample of after the three from part c has improperly folded brochures. What conclusions should be based on the control chart?
A With the new point, at least points in a row are below the centerline, which indicates that the process has gone out of control.
B Since at least one of the points is outside the control limits the process is still in control.
C Since the new point is also outside the control limits the process is still out of control.
D With the new point, at least points in a row are increasing, which indicates that the process has gone out of control.
Data
Step by Step Solution
There are 3 Steps involved in it
1 Expert Approved Answer
Step: 1 Unlock

Question Has Been Solved by an Expert!
Get step-by-step solutions from verified subject matter experts
Step: 2 Unlock
Step: 3 Unlock